SoftwarePerformanceAnalysis
ts60.com 时间:2021-04-10 阅读:()
MichelR.
Dagenais(michel.
dagenais@polymtl.
ca)Dept.
ofComputerEngineering,EcolePolytechnique,Montreal,CanadaKarimYaghmour(karim@opersys.
com)Opersys,Montreal,CanadaCharlesLevert(Charles.
Levert@ericsson.
ca)MakanPourzandi(Makan.
Pourzandi@ericsson.
ca)EricssonResearch,Montreal,Canada1.
AbstractThekeytospeedingupapplicationsisoftenunderstandingwheretheelapsedtimeisspent,andwhy.
ThisdocumentreviewsindepththefullarrayofperformanceanalysistoolsandtechniquesavailableonLinuxforthistask,fromthetraditionaltoolslikegcovandgprof,tothemoreadvancedtoolsstillunderdevelopmentlikeoprofileandtheLinuxTraceToolkit.
Thefocusismoreontheunderlyingdatacollectionandprocessingalgorithms,andtheiroverheadandprecision,thanonthecosmeticdetailsofthegraphicaluserinterfacefrontends.
2.
IntroductionCodecoveragetools(e.
g.
,Gcov[1])computetheexactnumberoftimeseachstatementisexecuted,andthuscaneasilypinpointfrequentlyexecutedsections.
However,codecoveragetoolscarryanonnegligibleexecutionoverhead,andmoreimportantlydonotmeasuretherelativeexecutioncostofdifferentstatements.
Timedomainsamplingtools(e.
g.
,Gprof[2])maythereforemoreaccuratelyreportlargecontributorstotheexecutiontimebysamplingatregulartimeintervalstheexecutionaddress.
Moreover,theoverheadcostmaybetradedoffforaccuracybyvaryingthetimeinterval.
Modernapplicationsandsystemspresentnewchallengesastheirperformancemaybestronglyaffectedbycachehitrates,diskaccesses,inter-processcommunications,synchronizationwaits,andoperatingsystemoverhead.
Thisiswherenewtoolsbasedonhardwareperformancecounterssampling(e.
g.
,Oprofile[3]),ordetailedanalysisoflowoverheadoperatingsystemtraces(e.
g.
,LinuxTraceToolkit[4])canbringmoreinformation.
Theymayforinstanceindicatecodesectionswithexceedinglyhighlevelofcachemissesorbranchesmispredictions,orestimatetheexecutiontimeoftheXwindowserver[5]onbehalfofeachofitsclients.
Section3discussesthealgorithmsandtechniquesusedtocollect,processandstoreperformancedata.
Thefollowingsectiondescribesanumberofspecificperformanceanalysistools,fromcommonlyusedtoolstomorerecentones,withalongersectiononpossibleextensionsandcustomisationstotheLinuxTraceToolkit.
Section5istheconclusion.
3.
PerformanceDataCollection,ProcessingandStorageInasimplemodel,apieceofperformancedataisobtained,andqueuedorstoredforlaterdisplay.
Inpractice,thegeneratedvolumeofdatamaybesuchthatsomeprocessingmayberequiredatdata1collectiontimetosynthesizemorecompactinformation.
Forexample,inalargescientificcomputerclusterof1024computers,eachtimeaprogramfunctioniscalled,theentryandexittimemaybecollected.
Sendingthesevaluesdirectlytoacentralserverwouldrapidlysaturatethenetworkandcarryanunbearableoverhead.
Instead,theentryandexittimemaybesubtractedandaccumulatedlocallyineachfunction,inordertoproduceasummaryoftheprocessingtimespentineachprogramfunction.
Individualprograms,uponexit,wouldsendtheexecutiontimehistogramtoacentralserverforofflinepreparationofperformancereports.
Thissectionexaminesthekeyaspectsofdatacollectionandprocessing:obtainingthedatapoints,accumulatingvaluesintemporarystorage,andsendingthevaluestostorageforofflineprocessinganddisplay.
3.
1.
DataCollectionSeveralactivitiesincludingdebuggingandprogramunderstandingrequiredatacollection,justlikeperformanceanalysis,andusethesametechniques.
Thefamiliardebuggingprocessisusedtoillustratecommondatacollectionmethods.
Thereisacompromisebetweentheexecutionoverheadandtheamountandprecisionofthedatacollected.
Sometimestheoverheadisunacceptablebecausetheresultingprogramexecutiontimebecomestoolarge,ortheprogramperformanceortherealtimeprogrambehaviorisskewedbythedatacollection.
Storingorsummingavalueinavariableisminimaloverhead.
Callinganotherfunctionforeachfunctionentryisalargeoverheadforsmallfunctions.
Writingperformancedatatoafileuponenteringabasicblock(i.
e.
,linearcodesection,withoutanyjump,andthusalwaysexecutedtogetherandthesamenumberoftimes)wouldsignificantlychangetheexecutionperformanceofaprogram.
3.
1.
1.
ManualProgramInstrumentationAddingaprintstatementisoftentheeasiestandmostflexiblewaytoobtainthedesiredinformation.
Allthedatastructuresandfunctionsaccessibletotheprogrammaybeusedtogeneratethedataprinted.
TheLinuxkernelcode,wherenoviceprogrammersareuncommon,containsnolessthan80000printkstatements.
Severalcommontools(netstat,vmstat,mtrace)usedatagatheringstatementsinsertedinthekernel,ortheClibrabry.
3.
1.
2.
AutomaticProgramInstrumentationCompilersandpreprocessingtoolsmaybeusedtosystematicallyinstrumentaprogrambyaddingdatagatheringstatementstothecodetheywouldnormallygenerate.
Typicallocationsforinsertingstatementsincludethefunctionsentryandexit,andtheentryoflinearcodesections(basicblocks).
Forexample,theGNUCompilerCollection,GCC[1],offersseveralcodeinstrumentationoptionstoinsertacalltofunctionmcountuponenteringeachfunction(option-pgusedforgprof),andtoinsertcallstohooksuponenteringlinearcodesectionsandjumpingtoothercodesections(options-ftest-coverageand-fprofile-arcswhichmaybeusedforgcov).
3.
1.
3.
BinaryInstrumentationInsomesituations,thesourcecodeisnotavailableforsourcelevelinstrumentationandrecompilation,oritissimplyinconvenient.
Therearetoolstomodifybinaryexecutablefilesinordertoinsertdatagatheringstatements(e.
g.
,EEL[6]).
2Ideally,theexistingbinaryinstructionsshouldbeshiftedafewbyteshigherintheaddressspaceeachtimeinstrumentationinstructionsneedtobeinserted.
Doingso,however,changesalltheaddressesintheprogramandalljumpsandcallsmustbefoundandadjustedaccordingly.
Unlesstheprogramsectioncontaininginstructionsdoesnotcontainanydata(e.
g.
,jumptables)andallinstructionshavethesamesize,thisrapidlygetsverytricky.
Anothereasiertechniqueiscodepatching.
Theinstruction(s)locatedwhereinstrumentationcodeshouldbeinsertedisreplacedbyajumptoanewcodesectionappendedtotheprogram,andcontainingtheinstrumentationcodeandthereplacedinstruction.
Onlytheoneortwoinstructionsoverwrittenbythejumpneedtoberelocated(addressadjusted)perinstrumentationpoint.
Asimplerformofcodepatchingisusedinmostdebuggerstoinsertbreakpoints.
Theinstructionwhereinstrumentationcodeshouldbeinsertedissavedawayandreplacedbyasoftinterruptinstruction.
Unlikejumpinstructionswhichareamongthelonguest,andmayoverwriteafewshorterinstructions,interruptinstructionsusuallyarethesmallestandoccupyasinglebyteoni386processors.
Oncetheinterruptinstructionisreached,theinterrupthandlerexecutestheinstrumentationcode,putsbackthesavedawayinstructionandexecutesitinsinglesteppingmode.
Thisway,anotherinterruptionisgeneratedafteritsexecution,atwhichpointtheinterruptinstructionisplacedbackforthenexttimetheprogramreachesthispoint.
Withthistechnique,onesoftinterruptandonesinglesteppinginterruptisrequiredforeachinstrumentationpoint.
Theaddressoftheinstructioncausingtheinterruptisusedtodeterminetheinstrumentationpointreachedandtheassociatedcodetoexecute.
Thisleastinvasivetechnique(noinstructionstorelocate)alsocarriesthelargestoverhead.
Interruptsareprocessedinmicrosecondsatbestwhilejumpsareexecutedinnanoseconds,asshownbelowwithGDB[7].
#Runaprogramundergdb[gzip-1.
2.
4a]$catgdb.
runfilegzip.
plainrun/dev/nullquit[gzip-1.
2.
4a]$timegdb-command=gdb.
run>gdb.
out23.
30user1.
53system0:30.
75elapsed80%CPU(0avgtext+0avgdata0maxresident)k0inputs+0outputs(1213major+875minor)pagefaults0swaps#RunaprogramunderGDBwithabreakpoint.
Thebreakpointisexecuted#6933680times,eachtimeprintinga".
"beforecontinuing.
[gzip-1.
2.
4a]$catgdb.
commandsfilegzip.
plainbreakdeflate.
c:679commands1silentprint".
"continueendrun/dev/nullquit#RunGDBwiththecommandfile[gzip-1.
2.
4a]$timegdb-command=gdb.
commands>gdb.
out3905.
78user1535.
75system2:02:48elapsed73%CPU3.
1.
4.
SamplingSamplingisoftenusedtopredictatlowcosttheoutcomeofanelectionbyaskingseveralhundred3peopletheirvotingpreferencesinsteadofcallingeachofthemillionseligiblevoters.
Similarly,insteadofrecordingtheexecutiontimeforeachfunction,theprogrammaybeinterruptedatregularintervals(e.
g.
,each10miliseconds)tosampletheaddressofthecurrentlyexecutedinstruction.
Thechancesoftheaddressbeingwithinaspecificfunctionisproportionaltotheproportionoftimespentinthatfunction(underrandomnessassumptions).
Simplesamplingbasedprogramslikegprofuseimprecisevirtualtimerswhicharecheckedeachtimetheoperatingsystemschedulerisrun.
Inprogramswithstronginteractionswiththescheduler(e.
g.
,frequentlypollingforI/Oorcallingyield),theresultsmaybeseverelyskewed.
Newertoolslikeoprofiletakeadvantageofhardwareperformancecounterswhichmaycountdifferentevents(cycles,cachemisses,branchestaken/nottaken.
.
.
),andgenerateaninterruptafteracertaincount.
Thisallowsvaryingeasilythesamplinginterval,tradingoffoverheadforaccuracy,andmeasuringseveraldifferentparametersapartfromexecutiontime.
Thelowachievableoverheadenablesmeasuringthecachemisseshistogramforaprogram,whichwouldbeimpracticalusingcodeinstrumentation.
3.
2.
PerformanceDataProcessingOnceadataelementisobtained,itmustfinditswaytotheresultsfile.
Tracingsystemsusuallyaddafewfields(recordnumber,time,address.
.
.
)tothedataelementandappendittoabufferwhichiswrittentodiskoncefull.
Thiswaythecompleteinformationisretainedbutthediskmayfillatanalarmingrate.
TracingthesystemcallsforaWebbrowsermaygenerateseveralmegabytesperminute.
Thealternativetosimplebufferingistoprocessandaggregatethedataelementsastheyaregenerated.
Typicallyacountervariablewillbeassociatedwitheachfunctionorbasicblock,andtheeventsoccuringtherewillbecountedastheyhappen.
Attheprogramend,oratregularintevals,thecontentofthesecountersiswrittentodisk.
Insomecases,thenumberofpossiblelocationsismuchlargerthanthenumberactuallyusedandhashtablesareused.
Thisisthecasewhencountingthecallstoafunctionbycaller.
Veryfewfunctionsamongallthefunctionsinaprogramactuallycallaspecificfunction;usinghashtablesisthusmoreefficientthanallocatingacounterforeachpossiblecaller-calleecombination.
3.
3.
PerformanceDataTransferandStorageInlowvolumeapplications,eventsaregeneratedeveryfewsecondsormore,andmaybewrittenastheyhappentoafiledescriptor.
Thisfiledescriptormaybeconnectedtoafile,asocketorevenagraphicalviewerwhichupdatesitsdisplayinrealtime.
Forlargervolumesofevents,eventsshouldbeappendedinmemorytoalargebuffer,writtentodiskinverylargechunks.
Whentheinstrumentedprogramisdifferentfromtheloggingprocesswritingtodisk,maximumperformancemaybeobtainedthroughtheuseofsharedmemorybetweentheinstrumentedprogramandtheloggingdaemon.
TheLinuxTraceToolkitusessharedmemorybetweentheinstrumentedkernelandthetracingdaemontoachievemaximumperformance.
Theperformanceparametersbeingmeasured(diskthroughput,executiontime,cachehits)willstronglyinfluencewhichoverheadshouldbeminimized.
Ifdiskaccesstimesaretobemeasured,theimpactoftheperformancedatagatheringondisksshouldbereduced,forinstancebywritingtoaseparatedisk,onaseparatediskcontroller,andevenacrossthenetworkonaseparatecomputer.
Ifonlyonediskisavailable,itisalsopossibletoreducethediskrequirementsattheexpenseofexecutiontimeusingdatacompression.
Mostsystemsperformdatacompressionofflineforarchivalpurposesbutnotduringthelivetracing.
44.
ReviewofPerformanceAnalysisToolsThetoolsreviewedinthissectionareallfreelyredistributableandcoverthefullspectrumofwidelyusedtechniquesforsoftwareperformanceanalysis.
Thesimplerandmorewidelydeployedtoolsarepresentedfirst.
Throughoutthissection,theGNUcompressionutilitygzip[8]willbeusedasasampletestcase,compressinga64MBlogfileto1.
6MB.
Itisusedtocomparetheoverheadofdifferentperformanceanalysistools.
#Runthenormalprogram[gzip-1.
2.
4a]$time.
/gzip.
plain/dev/null24.
09user0.
72system0:28.
16elapsed88%CPU4.
1.
CodeinstrumentationandresultsprocessingwithGCC/GCOVGcovispartofthestandardGNUCCompiler(GCC)distribution[1].
Whencompilingaprogramfoo.
cwiththe-ftest-coverageand-fprofile-arcsoptions,alistofthebasicblocksandbranchesaregeneratedinfilesfoo.
c.
bbandfoo.
c.
bbg,andthecodeisinstrumentedtocounttheexecutionfrequenciesofeachbasicblockandbranchandtowriteouttheresultsuponexit.
Theprogrammaythenbeexecutedandsumsitsresultsinfilefoo.
c.
da,whichcanlaterbeanalyzedwithgcovtoprintthesourcecodealongwithexecutionfrequencies.
Thistoolhasaverylowoverhead,asingleaddinstructionforeachbasicblockandeachbranchexecution.
Thebasicblockexecutionfrequenciesareusedtodetectfrequentlyusedcodesections,whereoptimisationcodingeffortsmaybeworthwhile.
Executionfrequenciesforbasicblocksandbranchesmaybeusedfortestcoverageanalysis.
Anysectionwithnullexecutioncounthasnotbeencoveredbythetestsusedwhenexecutingtheprogram.
Finally,branchescountsmaybeusedtocomputebranchprobabilities,whichmaybeusedinsubsequentcompilationstogeneratebettercodeforthemorefrequentcase.
AnotherGCCoption,-axproducessimilarinformationwithmorecontroloverthegenerateddatabutwithoutapost-processingtoollikeGcov.
Itcanproducefunctions,basicblocksandbranchesexecutioncounts,orafulltraceoffunctionandbasicblockentries.
Furthermore,itispossibletospecify5Figure1:Totalelapsedtimeforcompressinga64MBfilewithgzip,unmodified,withsamplingevery0.
01s,withinstrumentationatfunctionentries,andwithinstrumentationatbasicblockentries.
NormalSamplingFunctionBasicblock05101520253035functionstoexclude/includefromthisprofiling/tracing.
Asanexample,theGNUcompressionprogramgzipwasrecompiledwiththe-ftest-coverageand-fprofile-arcsoptionsandrunona64MBlogfile.
Theinstrumentedgziprequires5.
4%moreelapsedtimethanthenormalgzip.
Attheendoftheexecution,afilewiththe.
daextensioniscreatedforeachsourcecodefile(e.
g.
,deflate.
dafordeflate.
c).
Thesefilesmaythenbeusedbygcovtoproduceannotatedsourcecodefiles(e.
g.
,deflate.
c.
gcovfordeflate.
c).
#Runtheprogramcompiledandlinkedwithoptions#-ftest-coverageand-fprofile-arcs[gzip-1.
2.
4a]$time.
/gzip.
gcov/dev/null27.
04user0.
63system0:31.
36elapsed88%CPU#Files.
bband.
bbgareproducedatcompilationtime,files.
da#attheprogramexit.
[gzip-1.
2.
4a]$ls-alsdeflate.
*4-rw-rw-r--1dagenaisdagenais1100avr915:34deflate.
bb4-rw-rw-r--1dagenaisdagenais2048avr915:34deflate.
bbg32-rw-r--r--1dagenaisdagenais29179ao131993deflate.
c4-rw-rw-r--1dagenaisdagenais648avr1014:10deflate.
da20-rw-rw-r--1dagenaisdagenais18856avr1012:01deflate.
o#Performtheanalysisononeofthesourcefiles.
#Gcovreadsthe.
bb.
bbg.
daand.
cfilesandproduces.
c.
gcov[gzip-1.
2.
4a]$gcov-b-fdeflate.
c80.
77%of26sourcelinesexecutedinfunctionlm_init60.
00%of15branchesexecutedinfunctionlm_init40.
00%of15branchestakenatleastonceinfunctionlm_initNocallsinfunctionlm_init.
.
.
Creatingdeflate.
c.
gcov.
[gzip-1.
2.
4a]$lessdeflate.
c.
gcov.
.
.
5while(lookahead!
=0){branch0taken=0%6933680INSERT_STRING(strstart,hash_head);6933680prev_length=match_length,prev_match=match_start;6933680match_length=MIN_MATCH-1;6933680if(hash_head!
=NIL&&prev_lengthlookahead)match_length=lookahead;branch0taken=0%branch1taken=100%.
.
.
4.
2.
TimeBasedSamplingwithGPROFGprofispartoftheGNUbinutilspackage[2].
Whenaprogramfoo.
ciscompiledwiththe-pgoption,acalltofunctionmcountisaddedtoeachfunctionentry.
Moreover,thelinkstepusesversionsofthestandardlibrariescompiledwith-pgwhenavailable,andaddsamoduletoinitializethesamplingatthebeginningandtowriteouttheresultsattheend.
Optionally,compilationflag-gmaybespecifiedtoobtainsourcecodelinesaddresses(usuallyusedbydebuggers),and-atosimultaneouslycomputebasicblockexecutionfrequencies.
6Whentheprogramexecutes,aninterrupthandleriscalledeveryclocktick(10miliseconds)whichtakestheaddressoftheinterruptedinstructionandadds1tothecorrespondingbucketinalargearray.
Typicallythisarrayisaslargeastheprocessinstructionsareaandusesa4bytesintegercounterforeach4bytessectionintheprogram.
Eachtimeafunctioniscalled,theinternalmcountfunctiongetscalled,extractstheaddressesofthecallerandthecallee,andsumsthenumberofcallsforthiscaller-calleepairinalargehashtable.
Whentheprogramexits,thesamplescountsinthelargearray,andthecaller-calleecountsfromthehashtable,areprintedinaresultsfilenamedgmon.
out.
Whenthe-acompilationflagisspecified,basicblocksexecutioncountsarealsocomputedandareappendedtotheresultsfile.
TheGprofprogrammaythenbeusedtoreadresultsfiles,andtheprogramexecutableandsourcecodefiles,toproducedifferentreports.
Theflatprofilereportprintsforeachfunction(andeveneachsourcecodeline)thenumberofassociatedsamplesandthecorrespondingexecutiontimeprobablyspentinthatlocation.
Thefunctionsmaybeprintedindecreasingorderofexecutiontime,thuslistingontopthemosttimeconsumingfunctions,andbestcandidatesforoptimisation.
Thetimeassociatedwithinternalfunctionmcountcanbeusedtosubstract,andthuscompensate,theoverheadassociatedwiththeprofiling.
TheannotatedsourcecodereportissimilartotheoutputproducedbyGcov,listingtheexecutionfrequenciesforeachbasicblock.
Finally,Thecallgraphreportisasupersetoftheflatprofileandaddsinformationaboutcallersandcalledfunctions.
Foreachfunction,itliststhetotaltimespentinitself(numberofsamplestimessamplingperiod),andthecallingfunctions.
Foreachcallingfunctionislistedthenumberofcallsandtheproportionofthetotal;thisinformationisobtainedpreciselythroughthecallstomcountwherethecallerisrecordedinthecallcounts.
Theproportionofcallsfromacallerisusedtoestimatethetimespentinthecurrentfunctionbycaller.
Theunderlyingassumptionisthatcallstoafunctiontakethesametimeonaverageirrespectivefromthecaller.
Thisisclearlynotthecaseas,forinstance,afunctiondraw_iconmaycallscale_bitmapsforverysmallimageswhilefunctionscale_backgroundmaycallscale_bitmapsforimages500timeslarger.
Theexecutiontimespentforeachcallerispropagatedtothecallersresursively,startingfromtheleaffunctions.
Thisaddsanotherlistforeachfunctioninthecallgraphreport,thetimespentineachfunction(anditschildren)called.
Thetotaltimespentinthefunctionitselfandallitscalledchildrenisalsopartofthecallgraphreport.
Forrecursivecalls,aseparateentryiscreatedforthecyclewhichlistscallersandcalleesfromousidethecycle;then,entriesformembersofthecyclelistcallersandcalleesfromwithinthecycle.
Gprofandsimilartoolsofferanexcellentcompromiseoflowoverheadanddetailedusuallyreliableinformation.
Itmay,however,beinadequateorevenmisleadinginmoreinvolvedcaseswhere:thetimespentinafunctionisverydifferentdependingonthecaller.
Measuringitadequatelywouldrequiresamplingnotonlythecurrentlyexecutinginstructionaddressbutalsothecallersaddressonthestack,possiblyforseverallevels.
Thecallgraphreportcouldthenshowthetimespentinafunctionbasedonchainsofcallers,butthiswouldbemoredifficulttopresentclearly,andthenumberofsamplesassociatedwitheachchainislikelytobetoosmalltobereliable;thesamplingintervaliscorrelatedwiththeprogramactivity.
Whenaprogramcontinuouslymakesblockingsystemcalls,thereisachancethatthescheduleroftengivescontroltotheprogramandactivatesthevirtualtimerusedforsamplingwhentheprogramisinthesamearea,whichgetsoverrepresentedinthesamples;thetimespentnotexecutingtheprogram,waitingforthediskorforotherprocesses,isofinterest.
Inthatcase,othersourcesofinformationshouldbeusedtoannotatethereportswithinformationabout7timespentwaiting,toobtainthetotalelapsedtime,insteadofjusttheexecutiontime,ineachfunction;moreinformationisrequiredaboutwhytimeisspentineachsection(cachefaults,pagefaults.
.
.
).
#Runtheprogramcompiledwithout-pgandlinkedwith-pg#tomeasurethelowoverheadofsamplingalone.
[gzip-1.
2.
4a]$time.
/gzip.
pg-nomcount/dev/null24.
30user0.
62system0:28.
30elapsed88%CPU#Runtheprogramcompiledandlinkedwithoption-pg#Overheadisslightlylargerbutitprovidescallgraphinfo[gzip-1.
2.
4a]$time.
/gzip.
pg-static/dev/null25.
79user0.
51system0:29.
88elapsed88%CPU#Filegmon.
outisproducedwhentheprogramexits[gzip-1.
2.
4a]$ls-alsgmon.
out188-rw-rw-r--1useruser186366avr1014:07gmon.
out#Usegproftointerpretgmon.
out,usingdebuggingsymbols#informationfromtheexecutablefile[gzip-1.
2.
4a]$gprofgzip.
pg-static>gprof.
out#Lookattheresults,firsttheflatprofilewiththepercentageof#executiontimeforeachfunctionindecreasingorder.
[gzip-1.
2.
4a]$lessgprof.
outEachsamplecountsas0.
01seconds.
%cumulativeselfselftotaltimesecondssecondscallsms/callms/callname27.
137.
537.
5319573.
855.
95fill_window23.
2013.
976.
4416440.
0019205.
66deflate14.
8418.
094.
1219582.
102.
10updcrc12.
1621.
463.
38do_scan8.
3823.
792.
33short_loop3.
7824.
841.
05__mcount_internal3.
1325.
710.
87read.
.
.
#Thenthecallgraph.
Functionupdcrcuses4.
12sandcallsnone.
#Itiscalledfromzipandfile_read.
Functionfile_readis#calledfromlm_initandfill_window.
Itusesaboutnotimebut#callsupdrcforabout4.
12s.
This4.
12sisalmostallattributed#tocallerfill_window(1957/1958calls).
.
.
.
0.
000.
001/1958zip[3]4.
120.
001957/1958file_read[8][7]15.
64.
120.
001958updcrc[7]0.
000.
001/1958lm_init[27]0.
004.
121957/1958fill_window[6][8]15.
60.
004.
121958file_read[8]4.
120.
001957/1958updcrc[7].
.
.
4.
3.
HardwareCountedEventsSamplingwithOprofileOprofile[3]isverysimilartoGprof;itevenproducescompatibleresultsfiles.
Thetwoimportantdifferencesarethatitcollectssamplesbasedonhardwareperformancecountersinterrupts,andthatitoperatesonthecompletesystem(gatheringsamplescontinuouslyforallprogramsexecutingonthe8system).
Hardwareperformancecountersarenowavailableinallpowerfulmodernmicroprocessorsandmaybeusedtocountvariouseventsofinterestincludingclockcycles,L1orL2cachemisses,branches,branchestaken,andpipelinestalls.
Theperiodicsamplingisobtainedbyrequestinganinterruptwhenthecounterreachesacertaincount.
Oprofiledoesnotuseprograminstrumentation(i.
e.
,placingcallstomcountineachfunction).
Thus,norecompilationisnecessaryandtheoverheadislower,butcallgraphreportscannotbegenerated.
Theonlyrequirementisthatdebugginginformationisrequiredtocorrelatetheaddressofsampleswithprogramfunctionsandlinenumbers.
Becauseofitslowoverhead,itisnotuncommontokeepOprofilerunningforextendedperiodsonrunningserversystems.
Thewholesystemprofilingfeatureisparticularlyusefultoseewhichproportionofthetimeisspentineachprogram,thusdiscoveringwhoisusingupalltheresources.
Itisalsousefulwhenasingletaskinvolvingseveralprogramsisexecutedonasystem.
Forexample,whenanalysingthestartuptimeofasophisticatedWebbrowser,itispossibletoseethetimespentinfunctionsinthekernel,thebrowser,thewindowmanager,theXserverandvariousdaemons.
Insomerarecases,theinformationproducedbyhardwareperformancecounterssamplingtoolsmaybebiased.
Indeed,areal-timeprocessusingthesameperiodasthesamplingtoolmayhaveitssamplesgrosslyunderoroverrepresented.
Asimplesolutionistorandomlyvarythesamplingperiodaroundatargetaverage.
#Runtheoprofilegraphicaluserinterface,clicktostartthedaemon[gzip-1.
2.
4a]$oprof_start#Runtheunmodifiedprogram(withdebuggingsymbolspresent)[gzip-1.
2.
4a]$time.
/gzip.
plain/dev/null24.
40user0.
87system0:27.
67elapsed91%CPU#Stoptheprofilingdaemonandextractstatistics[gzip-1.
2.
4a]$oprofpp-l-igzip.
plain>gzip.
oprof#Lookattheresults[gzip-1.
2.
4a]$lessgzip.
oprofCputype:PIICpuspeedwas(MHzestimation):233.
140000Counted"clocksprocessorisnothalted",samplinginterval200000vmasamples%-agesymbolname0804810000_start.
.
.
08050504500.
059034long_loop080504e1680.
0802862limit_ok080504c11110.
131055longest_match080505721600.
188909the_end080505471710.
201896mismatch0804c5509881.
16651ct_tally0804c93011001.
29875send_bits0804c6d012821.
51363compress_block0805aad014651.
7297memcpy0805050d69058.
15259short_loop080505221210114.
2874do_scan0804ea101382116.
3182updcrc0804b4c02140525.
2724deflate0804b1202502029.
5406fill_window94.
4.
SystemCallsTracingusingStraceLinuxandPOSIXsystemsoffertheptracesystemcalltoallowoneprocesstomonitoranotherprocess.
Itisusedbydebuggersandothertoolslikestrace[9].
Whenaprogramisrununderstrace,itisblockedeachtimeitissuesasystemcall.
Thecontrolpassestostracebeforethesystemcall,toextractthevalueofthearguments,thesystemcallisthenperformedasusual,andthecontrolpassestostraceafterthesystemcalltoextractthereturnvalues.
Theoverheadcostisseveralmicrosecondsforeachsystemcall,comparabletohittingabreakpointinadebugger.
However,thenumberofsystemcallsisrelativelylowforCPUboundprocesseslikegzip.
#Tracethesystemcallsissuedduringtheexecution[gzip-1.
2.
4a]$timestrace-s120-f-F-otrace.
/gzip.
plain\/dev/null25.
23user1.
57system0:30.
97elapsed86%CPU#Examinethesystemcalltracefile[gzip-1.
2.
4a]$lesstrace2488execve(".
/gzip.
plain",[".
/gzip.
plain"],[/*44vars*/])=02488fcntl64(0,0x1,0,0xbffff804)=02488fcntl64(0x1,0x1,0x1,0xbffff804)=02488fcntl64(0x2,0x1,0x1,0xbffff804)=02488uname({sys="Linux",node="rocamadour"02488geteuid32()=53632488getuid32()=53632488getegid32()=11052488getgid32()=11052488brk(0)=0x810b3742488brk(0x810b394)=0x810b3942488brk(0x810c000)=0x810c0002488rt_sigaction(SIGINT,{SIG_IGN},{SIG_DFL},8)=02488rt_sigaction(SIGINT,{0x804aaa0,[INT],SA_RESTART|0x4000000},{SIG_IGN},8)=02488rt_sigaction(SIGTERM,{SIG_IGN},{SIG_DFL},8)=02488rt_sigaction(SIGTERM,{0x804aaa0,[TERM],SA_RESTART|0x4000000},{SIG_IGN},8)=02488rt_sigaction(SIGHUP,{SIG_IGN},{SIG_DFL},8)=02488rt_sigaction(SIGHUP,{0x804aaa0,[HUP],SA_RESTART|0x4000000},{SIG_IGN},8)=02488ioctl(1,0x5401,0xbffff6c0)=-1ENOTTY(Inappropriateioctlfordevice)2488fstat64(0,{st_mode=S_IFREG|0644,st_size=64140109,02488read(0,"recid=1,size=8,format=BINARY,event_type=4,facility=LTT,severity=DEBUG,\nuid=dagenais,gid=dagenais,pid=1953,pgrp=".
.
.
,65536)=65536.
.
.
4.
5.
LowOverheadKernelTracingwiththeLinuxTraceToolkitThedataaggregationperformedbythetoolsdiscussedinprevioussectionsisimportanttoobtainalowoverhead.
Thedownsideisthatsomeinformationislostintheaggregates(numberofcallsforeachfunctioninsteadofwhichfunctionwascalledwhenandinwhatorder).
Afulltraceofcollecteddataitemsrapidlyfillsadiskbutdoesnotaprioridiscardinformationthatmaynotseemusefulinitially,butcouldbefoundsolater.
Tracingisusedpervasivelyinsoftwareprojects,fromprintstatementstologgingdaemonslikesyslogdandklogd.
TheLinuxTraceToolkit[4]isextensible.
Itcomeswith60predefinedtracepointsinsertedinthekernel,dividedinto8categorieswhichmaybeenabled/disabledeitheratcompileoratruntime.
MoretracepointsmayeasilybeaddedbyrecompilingthekernelorusingtheDynamicProbescodepatchingsystem[10].
Itskeyfeaturesarelowoverheadandpost-processingtools.
10Lowoverheadisachievedbycarefullyselectingtheinformationtolog,andminimizingcontextswitching.
Sinceallschedulingchangesandsetuidcallsmaybetraced,thereisnoneedtorecordtheprocessoruseridwitheachevent.
Furthermore,mosteventsbeingcloselyspacedintime,32bitstimedifferencesarestoredinsteadoffull64bitsseconds/microsecondsvalues.
Alltheeventsareloggedbyappendingtheirdatatoalargedoublebuffer.
Whenabufferisfull,adaemonaccessesthebufferthroughsharedmemoryandcopiesitscontenttodisk.
Theoverheadoftracingabusysystemamountstolessthan5%fortheelapsedtimeanduptoseveralmegabytesperminuteoftracingdatatostoreondisk[11].
Thetraceanalysisisperformedoffline,tominimizetheoverheadduringdatacollection,andpossiblyonaremotehostwhenstudyingembeddedsystems.
Theinformationcontainedinthetrace(systemcalls,devicesoperations,schedulingchanges)issufficienttoreconstructthesystembehavior(includingwhichfiledescriptorisassociatedtowhichfileormemoryregion)andmaythereforebeusedforseveraldifferentanalyses.
Thetoolsincludedshowtheeventsgraphically,perprocessinatimeline,andcontainperprocesssummaries(executiontime,numberofcallspersystemcall,waittime,bytesread/written).
Newanalysistoolsmaybewrittenusingtheprovidedtracereadinglibrary,orbymodifyingtheprovidedtools.
Indeed,whileitiseasywithLTTtocapturealltheneededrawdata,synthesizingthedesiredhighlevelinformationismorechallenging.
Asatest,amodifiedtraceanalysistoolwasdevelopedtoanswerthefollowingnonobviousquestion:whereisthelargestartingtimeofapplicationssuchasGaleon,MozillaandOpenOfficespent4.
5.
1.
DecomposingtheWaitingTimeTraditionally,systemstatisticsdecomposetheelapsedtimeintousermodeexecutiontime,systemmodeexecutiontime,andwaitingtime.
Profilingtoolsaregoodatdecomposingtheexecutiontimebyfunctionorevensourcecodeline.
Theobjectiveherewasdecomposingthewaitingtimeintowaitingrunnable(waitingfortheCPU)andwaitingnonrunnable(blockedonI/O,orwaitingforaprocessoratimer).
Thisinformationmaybeextractedfromadetailedtrace:SchedulingChangeeventstellthestatusoftheoutgoingprocess(runnableornot).
WakeUpeventschangethestatusofaprocessfromnonrunnabletorunnable.
Iftheeventpriortobeingscheduledoutnonrunnableisareadorapagefaulttrap,theprocessiswaitingfortheassociatedfile.
Atablemustkeeptrackforeachprocessofalltheopenandmmapoperationsassociatingfileswithfiledescriptorsormemoryaddressranges.
Iftheeventpriortobeingscheduledoutnonrunnableisawaitpidcall,theprocessiswaitingfortheassociatedprocess.
Therearecaseswhereaprocessiswaitingforoneofseveralpossiblefilesorprocesses,withcallstowait,select,orpoll.
Inthatcase,thewaitingtimeisattributedtotheprocessorfilewhichcausesthecalltoterminate.
Pollandwaitmayalsoendbecauseofatimeout.
Thewaittimeisthenattributedtothemoregeneralwaitfortimeoutcategory.
Atracewasgeneratedonafreshlyrebootedsystem,withnootheractivity,whilestartinguplargeprogramsoneafteranotherbutwithoutanyoverlap.
ThewaitingtimeforGaleon[12],forinstance,wasdecomposedintoseveralwait-for-fileandwait-for-processcomponents,whichaccountedfor7.
96softhetotal9.
27s.
Theremaining1.
31sismostlywait-for-timeout(0.
89sawaitingamouseclick)and11only0.
42swait-generic.
Thewait-generictimecouldbefurtherreducedbyidentifyingintheirowncategoryothersystemcalleventsinthetrace,inadditiontoread,select,poll,waitpidandwait.
Thewait-generictimeisnonethelessavailablebysystemcallcategory;.
31soutofthe.
42stotalbelongstostatsystemcalls.
#BootwiththeLTTenabledkernelandstarttheLTTdaemon[gzip-1.
2.
4a]$tracedaemon-ts60/dev/tracertrace1.
tracetrace1.
procTraceDaemon:OutputfilereadyTraceDaemon:TracedriveropenTraceDaemon:Tracebuffersare1000000bytesTraceDaemon:Fetchingeipforsyscallondepth:0TraceDaemon:Daemonwilrunfor:(60,0)TraceDaemon:Donemapping/procTraceDaemon:Endoftracing#Analysethetraceoutput[gzip-1.
2.
4a]$tracevisualizer-atrace1.
tracetrace1.
proctrace1.
out#Lookatthetraceanalysis[gzip-1.
2.
4a]$lesstrace1.
out.
.
.
Process(1684,1658):galeon:galeon-bin.
.
.
UserMode:CPU5.
894726Elapsed15.
677299WaitCPU2.
358053WaitFork0.
000002BH811KernelTimer610PacketIn80PacketOut41SchedIn1330TimerExpire136SyscallMode:Elapsed/Calls0.
0003861CPU0.
308954Elapsed5.
119347WaitCPU0.
599823WaitFile-001.
png0.
000453WaitFile-002.
png0.
000346WaitFile-003.
png0.
000213WaitFile-004.
png0.
000216WaitFile-005.
png0.
000430.
.
.
sys_fcntl64Elapsed/Calls0.
0000054CPU0.
000286Elapsed0.
000286Calls53TrapspagefaultElapsed/Calls0.
0003101CPU0.
179146Elapsed2.
444663WaitCPU0.
448110WaitFile-galeon-bin1.
816968BH38Calls7883KernelTimer23PacketIn212PacketOut1PageAlloc78SchedIn459TimerExpire2IRQstimerElapsed/Calls0.
0000118CPU0.
007725Elapsed0.
007725Calls657usb-uhci,eth0Elapsed/Calls0.
0000263CPU0.
003610Elapsed0.
003625Calls138.
.
.
Trapentry1018876582.
807382168413TRAP:pagefault;EIP:0x08068FC7Trapexit1018876582.
80738716847Syscallentry1018876582.
807421168412SYSCALL:execve;EIP:0x080690D7Filesystem1018876582.
807452168427EXEC:galeonMemory1018876582.
807494168412PAGEALLOCORDER:0Memory1018876582.
807569168412STARTPAGEWAITSchedchange1018876582.
807645157919IN:1579;OUT:1684;STATE:2Filesystem1018876582.
807656157920POLL:3;MASK:0Filesystem1018876582.
807662157920POLL:10;MASK:0Filesystem1018876582.
807666157920POLL:4;MASK:0Filesystem1018876582.
807670157920POLL:5;MASK:0Filesystem1018876582.
807675157920POLL:6;MASK:0Filesystem1018876582.
807680157920POLL:13;MASK:0Memory1018876582.
807688157912PAGEFREEORDER:0Memory1018876582.
807699157912PAGEFREEORDER:0Syscallexit1018876582.
80770215797Syscallentry1018876582.
807731157912SYSCALL:gettimeofday;EIP:0x0805816DSyscallexit1018876582.
80773315797Syscallentry1018876582.
807758157912SYSCALL:ioctl;EIP:0x08056F30Thebiggersurprisewasthe3.
5swait-for-CPUsincenothingelsewashappeningonthesystem.
Theanswerliesinasynchronouslycooperatingprocesses.
Indeed,Galeonstartsanumberofhelpersub-processesandusuallyblocksawaitingananswer.
Thisshowsupnicelyinthewait-for-processcategoryalongwiththesub-processid.
However,GaleonisacomplexgraphicalapplicationwhichusestheXwindowserver[5]forgraphicsrendering.
TheXserverisoptimisedtoavoidblockingusingasynchronousinteractionswheneverpossible.
Thisallowsbatchingrenderingoperations,butalsoparallelexecutionwhentheapplicationandtheXserverarerunningonseparateprocessors.
4.
5.
2.
IdentifyingServersWorkingonbehalfofClientsThelastanalysisrefinementwasdecomposingtheexecutiontimeofaserverprocess,labeledCPU,intoCPU-for-Clientcomponents.
Atypicalclientserverrelationshipmaybeidentifiedbythepatternofaserverlisteningonasocket,aclientconnectingtothesocket,andtheserveracceptingtheconnection.
13Theserverandclientthencommunicatebyreadingandwritingtothesocketuntiltherequestisservedandtheservergoesidle.
Theserverthenawaitsnewconnectionsorrequestsfromclientsusingaselectorpollsystemcall.
Assumingthataserver,afteritsinitializationphase,isalwaysworkingonbehalfofaclient,theservergetsintoCPU-for-Clientxwheneveritacceptsaconnectionorreadsfromaconnectiontoclientx.
Thissimpleheuristicproducesinterestingresultsinmanycases.
However,itdoesnotmodelcaseswhererequestsaregrouped.
Forexample,ifnineclientsmakeasynchronousrequestswhicharesimplybufferedbytheserver,andupontherequestfromthetenthclient,allbufferedrequestsareexecuted,thetimespentservingthelastisoverestimated.
Complexinteractionsbetweenclientsandserversareevenmoredifficulttoautomaticallyrecognizeinordertoattributeservingtimeappropriatelytoclients.
Forinstance,GaleonconnectstotheGNOMEconfigurationdaemon,Gconfd,toexpressinterestinanumberofconfigurationparameters,leavingacallbacksocketaddress.
Gconfdthenconnectstothiscallbackaddressandprovidesthecurrentvaluesfortheparameters,andeventuallyupdatestotheseparameters.
GaleonthenappearstobeservingparameterchangerequestsfromclientGconfd.
4.
6.
DiscussionTheLinuxTraceToolkitisoneofthebestsolutionsforindepthlowlevelsystemstudies.
Itiswidelyusedinembeddedandreal-timesystems,andcouldeasilybeusedinoperatingsystemsandreal-timeprogrammingcourses.
Itcouldproveveryusefultodevelopersandsystemadministratorswhenstronginteractionsbetweenapplicationsandtheoperatingsystemareencountered.
ItisstillpendingintegrationinthemainLinuxkernel.
Thus,akernelpatchandrecompilation,oraspecialkernel,arerequiredontopoftheLTTtracingdaemonandtracingtoolspackage.
5.
ConclusionTraditionaltoolslikeGcov,Gprof,andStracehaveexistedforyears,withmanyvariantsintermsofpresentation(graphs,colors,evenanimations)ondifferentplatforms.
Theserepresentmature,simpleandefficientwaystoobtainusefulinformation.
Theappearanceofhardwareperformancecountersinmicroprocessorsinthe1990swastheenablingtechnologyforsamplingtoolslikeOprofileprovidingmoreprecisesamplingandseveraltypesofsamples(cyclecount,cachemisses.
.
.
).
Anotherimportantenablingtechnologyinthefieldofsystemperformanceanalysisisthesourcecodeavailabilityoffreesoftware.
Theprintstatementspreviouslyinsertedbyprogrammersonlyintheirapplicationscannowbeplacedeverywhereinthesystem.
TheLinuxTraceToolkitprovidesthefirst60interestingtracingpoints.
Moreimportantly,itsimplifiestheinsertionofmoretracepointswhichwillenableanumberofsophisticatedanalysistoolsneededtobetterunderstand,studyandimprovecomplexdistributedsystems.
Bibliography[1]FreeSoftwareFoundation,"GNUCompilerCollection",http://gcc.
gnu.
org/.
[2]FreeSoftwareFoundation,"BinaryTools",http://sources.
redhat.
com/binutils/.
[3]JohnLevonetal.
,"Oprofile",http://oprofile.
sourceforge.
net.
[4]KarimYaghmour,"LinuxTraceToolkit",http://www.
opersys.
com/LTT.
14[5]XFree86Project,"TheXFree86Project",http://www.
xfree86.
org.
[6]JamesLarusetal.
,"EEL:AnExecutableEditingLibrary",http://www.
cs.
wisc.
edu/~larus/eel.
html.
[7]FreeSoftwareFoundation,"TheGNUProjectDebugger",http://sources.
redhat.
com/gdb/.
[8]Jean-LoupGailly,"GNUCompressionUtilityGzip",http://www.
gnu.
org/software/gzip/gzip.
html.
[9]WichertAkkermanetal.
,"Strace",http://www.
liacs.
nl/~wichert/strace/.
[10]RichardJ.
Mooreetal,"DynamicProbes",http://www.
ibm.
com/developerworks/oss/linux/projects/dprobes/.
[11]K.
YaghmourandM.
R.
Dagenais,"Measuringandcharacterizingsystembehaviorusingkernel-leveleventlogging",ProceedingsoftheUSENIXAnnual2000TechnicalConference,SanDiego,California,USA,June2000[12]MarcoPesentiGrittietal,"Galeon:theWeb,onlytheWeb",http://galeon.
sourceforge.
net/.
15
Dagenais(michel.
dagenais@polymtl.
ca)Dept.
ofComputerEngineering,EcolePolytechnique,Montreal,CanadaKarimYaghmour(karim@opersys.
com)Opersys,Montreal,CanadaCharlesLevert(Charles.
Levert@ericsson.
ca)MakanPourzandi(Makan.
Pourzandi@ericsson.
ca)EricssonResearch,Montreal,Canada1.
AbstractThekeytospeedingupapplicationsisoftenunderstandingwheretheelapsedtimeisspent,andwhy.
ThisdocumentreviewsindepththefullarrayofperformanceanalysistoolsandtechniquesavailableonLinuxforthistask,fromthetraditionaltoolslikegcovandgprof,tothemoreadvancedtoolsstillunderdevelopmentlikeoprofileandtheLinuxTraceToolkit.
Thefocusismoreontheunderlyingdatacollectionandprocessingalgorithms,andtheiroverheadandprecision,thanonthecosmeticdetailsofthegraphicaluserinterfacefrontends.
2.
IntroductionCodecoveragetools(e.
g.
,Gcov[1])computetheexactnumberoftimeseachstatementisexecuted,andthuscaneasilypinpointfrequentlyexecutedsections.
However,codecoveragetoolscarryanonnegligibleexecutionoverhead,andmoreimportantlydonotmeasuretherelativeexecutioncostofdifferentstatements.
Timedomainsamplingtools(e.
g.
,Gprof[2])maythereforemoreaccuratelyreportlargecontributorstotheexecutiontimebysamplingatregulartimeintervalstheexecutionaddress.
Moreover,theoverheadcostmaybetradedoffforaccuracybyvaryingthetimeinterval.
Modernapplicationsandsystemspresentnewchallengesastheirperformancemaybestronglyaffectedbycachehitrates,diskaccesses,inter-processcommunications,synchronizationwaits,andoperatingsystemoverhead.
Thisiswherenewtoolsbasedonhardwareperformancecounterssampling(e.
g.
,Oprofile[3]),ordetailedanalysisoflowoverheadoperatingsystemtraces(e.
g.
,LinuxTraceToolkit[4])canbringmoreinformation.
Theymayforinstanceindicatecodesectionswithexceedinglyhighlevelofcachemissesorbranchesmispredictions,orestimatetheexecutiontimeoftheXwindowserver[5]onbehalfofeachofitsclients.
Section3discussesthealgorithmsandtechniquesusedtocollect,processandstoreperformancedata.
Thefollowingsectiondescribesanumberofspecificperformanceanalysistools,fromcommonlyusedtoolstomorerecentones,withalongersectiononpossibleextensionsandcustomisationstotheLinuxTraceToolkit.
Section5istheconclusion.
3.
PerformanceDataCollection,ProcessingandStorageInasimplemodel,apieceofperformancedataisobtained,andqueuedorstoredforlaterdisplay.
Inpractice,thegeneratedvolumeofdatamaybesuchthatsomeprocessingmayberequiredatdata1collectiontimetosynthesizemorecompactinformation.
Forexample,inalargescientificcomputerclusterof1024computers,eachtimeaprogramfunctioniscalled,theentryandexittimemaybecollected.
Sendingthesevaluesdirectlytoacentralserverwouldrapidlysaturatethenetworkandcarryanunbearableoverhead.
Instead,theentryandexittimemaybesubtractedandaccumulatedlocallyineachfunction,inordertoproduceasummaryoftheprocessingtimespentineachprogramfunction.
Individualprograms,uponexit,wouldsendtheexecutiontimehistogramtoacentralserverforofflinepreparationofperformancereports.
Thissectionexaminesthekeyaspectsofdatacollectionandprocessing:obtainingthedatapoints,accumulatingvaluesintemporarystorage,andsendingthevaluestostorageforofflineprocessinganddisplay.
3.
1.
DataCollectionSeveralactivitiesincludingdebuggingandprogramunderstandingrequiredatacollection,justlikeperformanceanalysis,andusethesametechniques.
Thefamiliardebuggingprocessisusedtoillustratecommondatacollectionmethods.
Thereisacompromisebetweentheexecutionoverheadandtheamountandprecisionofthedatacollected.
Sometimestheoverheadisunacceptablebecausetheresultingprogramexecutiontimebecomestoolarge,ortheprogramperformanceortherealtimeprogrambehaviorisskewedbythedatacollection.
Storingorsummingavalueinavariableisminimaloverhead.
Callinganotherfunctionforeachfunctionentryisalargeoverheadforsmallfunctions.
Writingperformancedatatoafileuponenteringabasicblock(i.
e.
,linearcodesection,withoutanyjump,andthusalwaysexecutedtogetherandthesamenumberoftimes)wouldsignificantlychangetheexecutionperformanceofaprogram.
3.
1.
1.
ManualProgramInstrumentationAddingaprintstatementisoftentheeasiestandmostflexiblewaytoobtainthedesiredinformation.
Allthedatastructuresandfunctionsaccessibletotheprogrammaybeusedtogeneratethedataprinted.
TheLinuxkernelcode,wherenoviceprogrammersareuncommon,containsnolessthan80000printkstatements.
Severalcommontools(netstat,vmstat,mtrace)usedatagatheringstatementsinsertedinthekernel,ortheClibrabry.
3.
1.
2.
AutomaticProgramInstrumentationCompilersandpreprocessingtoolsmaybeusedtosystematicallyinstrumentaprogrambyaddingdatagatheringstatementstothecodetheywouldnormallygenerate.
Typicallocationsforinsertingstatementsincludethefunctionsentryandexit,andtheentryoflinearcodesections(basicblocks).
Forexample,theGNUCompilerCollection,GCC[1],offersseveralcodeinstrumentationoptionstoinsertacalltofunctionmcountuponenteringeachfunction(option-pgusedforgprof),andtoinsertcallstohooksuponenteringlinearcodesectionsandjumpingtoothercodesections(options-ftest-coverageand-fprofile-arcswhichmaybeusedforgcov).
3.
1.
3.
BinaryInstrumentationInsomesituations,thesourcecodeisnotavailableforsourcelevelinstrumentationandrecompilation,oritissimplyinconvenient.
Therearetoolstomodifybinaryexecutablefilesinordertoinsertdatagatheringstatements(e.
g.
,EEL[6]).
2Ideally,theexistingbinaryinstructionsshouldbeshiftedafewbyteshigherintheaddressspaceeachtimeinstrumentationinstructionsneedtobeinserted.
Doingso,however,changesalltheaddressesintheprogramandalljumpsandcallsmustbefoundandadjustedaccordingly.
Unlesstheprogramsectioncontaininginstructionsdoesnotcontainanydata(e.
g.
,jumptables)andallinstructionshavethesamesize,thisrapidlygetsverytricky.
Anothereasiertechniqueiscodepatching.
Theinstruction(s)locatedwhereinstrumentationcodeshouldbeinsertedisreplacedbyajumptoanewcodesectionappendedtotheprogram,andcontainingtheinstrumentationcodeandthereplacedinstruction.
Onlytheoneortwoinstructionsoverwrittenbythejumpneedtoberelocated(addressadjusted)perinstrumentationpoint.
Asimplerformofcodepatchingisusedinmostdebuggerstoinsertbreakpoints.
Theinstructionwhereinstrumentationcodeshouldbeinsertedissavedawayandreplacedbyasoftinterruptinstruction.
Unlikejumpinstructionswhichareamongthelonguest,andmayoverwriteafewshorterinstructions,interruptinstructionsusuallyarethesmallestandoccupyasinglebyteoni386processors.
Oncetheinterruptinstructionisreached,theinterrupthandlerexecutestheinstrumentationcode,putsbackthesavedawayinstructionandexecutesitinsinglesteppingmode.
Thisway,anotherinterruptionisgeneratedafteritsexecution,atwhichpointtheinterruptinstructionisplacedbackforthenexttimetheprogramreachesthispoint.
Withthistechnique,onesoftinterruptandonesinglesteppinginterruptisrequiredforeachinstrumentationpoint.
Theaddressoftheinstructioncausingtheinterruptisusedtodeterminetheinstrumentationpointreachedandtheassociatedcodetoexecute.
Thisleastinvasivetechnique(noinstructionstorelocate)alsocarriesthelargestoverhead.
Interruptsareprocessedinmicrosecondsatbestwhilejumpsareexecutedinnanoseconds,asshownbelowwithGDB[7].
#Runaprogramundergdb[gzip-1.
2.
4a]$catgdb.
runfilegzip.
plainrun/dev/nullquit[gzip-1.
2.
4a]$timegdb-command=gdb.
run>gdb.
out23.
30user1.
53system0:30.
75elapsed80%CPU(0avgtext+0avgdata0maxresident)k0inputs+0outputs(1213major+875minor)pagefaults0swaps#RunaprogramunderGDBwithabreakpoint.
Thebreakpointisexecuted#6933680times,eachtimeprintinga".
"beforecontinuing.
[gzip-1.
2.
4a]$catgdb.
commandsfilegzip.
plainbreakdeflate.
c:679commands1silentprint".
"continueendrun/dev/nullquit#RunGDBwiththecommandfile[gzip-1.
2.
4a]$timegdb-command=gdb.
commands>gdb.
out3905.
78user1535.
75system2:02:48elapsed73%CPU3.
1.
4.
SamplingSamplingisoftenusedtopredictatlowcosttheoutcomeofanelectionbyaskingseveralhundred3peopletheirvotingpreferencesinsteadofcallingeachofthemillionseligiblevoters.
Similarly,insteadofrecordingtheexecutiontimeforeachfunction,theprogrammaybeinterruptedatregularintervals(e.
g.
,each10miliseconds)tosampletheaddressofthecurrentlyexecutedinstruction.
Thechancesoftheaddressbeingwithinaspecificfunctionisproportionaltotheproportionoftimespentinthatfunction(underrandomnessassumptions).
Simplesamplingbasedprogramslikegprofuseimprecisevirtualtimerswhicharecheckedeachtimetheoperatingsystemschedulerisrun.
Inprogramswithstronginteractionswiththescheduler(e.
g.
,frequentlypollingforI/Oorcallingyield),theresultsmaybeseverelyskewed.
Newertoolslikeoprofiletakeadvantageofhardwareperformancecounterswhichmaycountdifferentevents(cycles,cachemisses,branchestaken/nottaken.
.
.
),andgenerateaninterruptafteracertaincount.
Thisallowsvaryingeasilythesamplinginterval,tradingoffoverheadforaccuracy,andmeasuringseveraldifferentparametersapartfromexecutiontime.
Thelowachievableoverheadenablesmeasuringthecachemisseshistogramforaprogram,whichwouldbeimpracticalusingcodeinstrumentation.
3.
2.
PerformanceDataProcessingOnceadataelementisobtained,itmustfinditswaytotheresultsfile.
Tracingsystemsusuallyaddafewfields(recordnumber,time,address.
.
.
)tothedataelementandappendittoabufferwhichiswrittentodiskoncefull.
Thiswaythecompleteinformationisretainedbutthediskmayfillatanalarmingrate.
TracingthesystemcallsforaWebbrowsermaygenerateseveralmegabytesperminute.
Thealternativetosimplebufferingistoprocessandaggregatethedataelementsastheyaregenerated.
Typicallyacountervariablewillbeassociatedwitheachfunctionorbasicblock,andtheeventsoccuringtherewillbecountedastheyhappen.
Attheprogramend,oratregularintevals,thecontentofthesecountersiswrittentodisk.
Insomecases,thenumberofpossiblelocationsismuchlargerthanthenumberactuallyusedandhashtablesareused.
Thisisthecasewhencountingthecallstoafunctionbycaller.
Veryfewfunctionsamongallthefunctionsinaprogramactuallycallaspecificfunction;usinghashtablesisthusmoreefficientthanallocatingacounterforeachpossiblecaller-calleecombination.
3.
3.
PerformanceDataTransferandStorageInlowvolumeapplications,eventsaregeneratedeveryfewsecondsormore,andmaybewrittenastheyhappentoafiledescriptor.
Thisfiledescriptormaybeconnectedtoafile,asocketorevenagraphicalviewerwhichupdatesitsdisplayinrealtime.
Forlargervolumesofevents,eventsshouldbeappendedinmemorytoalargebuffer,writtentodiskinverylargechunks.
Whentheinstrumentedprogramisdifferentfromtheloggingprocesswritingtodisk,maximumperformancemaybeobtainedthroughtheuseofsharedmemorybetweentheinstrumentedprogramandtheloggingdaemon.
TheLinuxTraceToolkitusessharedmemorybetweentheinstrumentedkernelandthetracingdaemontoachievemaximumperformance.
Theperformanceparametersbeingmeasured(diskthroughput,executiontime,cachehits)willstronglyinfluencewhichoverheadshouldbeminimized.
Ifdiskaccesstimesaretobemeasured,theimpactoftheperformancedatagatheringondisksshouldbereduced,forinstancebywritingtoaseparatedisk,onaseparatediskcontroller,andevenacrossthenetworkonaseparatecomputer.
Ifonlyonediskisavailable,itisalsopossibletoreducethediskrequirementsattheexpenseofexecutiontimeusingdatacompression.
Mostsystemsperformdatacompressionofflineforarchivalpurposesbutnotduringthelivetracing.
44.
ReviewofPerformanceAnalysisToolsThetoolsreviewedinthissectionareallfreelyredistributableandcoverthefullspectrumofwidelyusedtechniquesforsoftwareperformanceanalysis.
Thesimplerandmorewidelydeployedtoolsarepresentedfirst.
Throughoutthissection,theGNUcompressionutilitygzip[8]willbeusedasasampletestcase,compressinga64MBlogfileto1.
6MB.
Itisusedtocomparetheoverheadofdifferentperformanceanalysistools.
#Runthenormalprogram[gzip-1.
2.
4a]$time.
/gzip.
plain/dev/null24.
09user0.
72system0:28.
16elapsed88%CPU4.
1.
CodeinstrumentationandresultsprocessingwithGCC/GCOVGcovispartofthestandardGNUCCompiler(GCC)distribution[1].
Whencompilingaprogramfoo.
cwiththe-ftest-coverageand-fprofile-arcsoptions,alistofthebasicblocksandbranchesaregeneratedinfilesfoo.
c.
bbandfoo.
c.
bbg,andthecodeisinstrumentedtocounttheexecutionfrequenciesofeachbasicblockandbranchandtowriteouttheresultsuponexit.
Theprogrammaythenbeexecutedandsumsitsresultsinfilefoo.
c.
da,whichcanlaterbeanalyzedwithgcovtoprintthesourcecodealongwithexecutionfrequencies.
Thistoolhasaverylowoverhead,asingleaddinstructionforeachbasicblockandeachbranchexecution.
Thebasicblockexecutionfrequenciesareusedtodetectfrequentlyusedcodesections,whereoptimisationcodingeffortsmaybeworthwhile.
Executionfrequenciesforbasicblocksandbranchesmaybeusedfortestcoverageanalysis.
Anysectionwithnullexecutioncounthasnotbeencoveredbythetestsusedwhenexecutingtheprogram.
Finally,branchescountsmaybeusedtocomputebranchprobabilities,whichmaybeusedinsubsequentcompilationstogeneratebettercodeforthemorefrequentcase.
AnotherGCCoption,-axproducessimilarinformationwithmorecontroloverthegenerateddatabutwithoutapost-processingtoollikeGcov.
Itcanproducefunctions,basicblocksandbranchesexecutioncounts,orafulltraceoffunctionandbasicblockentries.
Furthermore,itispossibletospecify5Figure1:Totalelapsedtimeforcompressinga64MBfilewithgzip,unmodified,withsamplingevery0.
01s,withinstrumentationatfunctionentries,andwithinstrumentationatbasicblockentries.
NormalSamplingFunctionBasicblock05101520253035functionstoexclude/includefromthisprofiling/tracing.
Asanexample,theGNUcompressionprogramgzipwasrecompiledwiththe-ftest-coverageand-fprofile-arcsoptionsandrunona64MBlogfile.
Theinstrumentedgziprequires5.
4%moreelapsedtimethanthenormalgzip.
Attheendoftheexecution,afilewiththe.
daextensioniscreatedforeachsourcecodefile(e.
g.
,deflate.
dafordeflate.
c).
Thesefilesmaythenbeusedbygcovtoproduceannotatedsourcecodefiles(e.
g.
,deflate.
c.
gcovfordeflate.
c).
#Runtheprogramcompiledandlinkedwithoptions#-ftest-coverageand-fprofile-arcs[gzip-1.
2.
4a]$time.
/gzip.
gcov/dev/null27.
04user0.
63system0:31.
36elapsed88%CPU#Files.
bband.
bbgareproducedatcompilationtime,files.
da#attheprogramexit.
[gzip-1.
2.
4a]$ls-alsdeflate.
*4-rw-rw-r--1dagenaisdagenais1100avr915:34deflate.
bb4-rw-rw-r--1dagenaisdagenais2048avr915:34deflate.
bbg32-rw-r--r--1dagenaisdagenais29179ao131993deflate.
c4-rw-rw-r--1dagenaisdagenais648avr1014:10deflate.
da20-rw-rw-r--1dagenaisdagenais18856avr1012:01deflate.
o#Performtheanalysisononeofthesourcefiles.
#Gcovreadsthe.
bb.
bbg.
daand.
cfilesandproduces.
c.
gcov[gzip-1.
2.
4a]$gcov-b-fdeflate.
c80.
77%of26sourcelinesexecutedinfunctionlm_init60.
00%of15branchesexecutedinfunctionlm_init40.
00%of15branchestakenatleastonceinfunctionlm_initNocallsinfunctionlm_init.
.
.
Creatingdeflate.
c.
gcov.
[gzip-1.
2.
4a]$lessdeflate.
c.
gcov.
.
.
5while(lookahead!
=0){branch0taken=0%6933680INSERT_STRING(strstart,hash_head);6933680prev_length=match_length,prev_match=match_start;6933680match_length=MIN_MATCH-1;6933680if(hash_head!
=NIL&&prev_lengthlookahead)match_length=lookahead;branch0taken=0%branch1taken=100%.
.
.
4.
2.
TimeBasedSamplingwithGPROFGprofispartoftheGNUbinutilspackage[2].
Whenaprogramfoo.
ciscompiledwiththe-pgoption,acalltofunctionmcountisaddedtoeachfunctionentry.
Moreover,thelinkstepusesversionsofthestandardlibrariescompiledwith-pgwhenavailable,andaddsamoduletoinitializethesamplingatthebeginningandtowriteouttheresultsattheend.
Optionally,compilationflag-gmaybespecifiedtoobtainsourcecodelinesaddresses(usuallyusedbydebuggers),and-atosimultaneouslycomputebasicblockexecutionfrequencies.
6Whentheprogramexecutes,aninterrupthandleriscalledeveryclocktick(10miliseconds)whichtakestheaddressoftheinterruptedinstructionandadds1tothecorrespondingbucketinalargearray.
Typicallythisarrayisaslargeastheprocessinstructionsareaandusesa4bytesintegercounterforeach4bytessectionintheprogram.
Eachtimeafunctioniscalled,theinternalmcountfunctiongetscalled,extractstheaddressesofthecallerandthecallee,andsumsthenumberofcallsforthiscaller-calleepairinalargehashtable.
Whentheprogramexits,thesamplescountsinthelargearray,andthecaller-calleecountsfromthehashtable,areprintedinaresultsfilenamedgmon.
out.
Whenthe-acompilationflagisspecified,basicblocksexecutioncountsarealsocomputedandareappendedtotheresultsfile.
TheGprofprogrammaythenbeusedtoreadresultsfiles,andtheprogramexecutableandsourcecodefiles,toproducedifferentreports.
Theflatprofilereportprintsforeachfunction(andeveneachsourcecodeline)thenumberofassociatedsamplesandthecorrespondingexecutiontimeprobablyspentinthatlocation.
Thefunctionsmaybeprintedindecreasingorderofexecutiontime,thuslistingontopthemosttimeconsumingfunctions,andbestcandidatesforoptimisation.
Thetimeassociatedwithinternalfunctionmcountcanbeusedtosubstract,andthuscompensate,theoverheadassociatedwiththeprofiling.
TheannotatedsourcecodereportissimilartotheoutputproducedbyGcov,listingtheexecutionfrequenciesforeachbasicblock.
Finally,Thecallgraphreportisasupersetoftheflatprofileandaddsinformationaboutcallersandcalledfunctions.
Foreachfunction,itliststhetotaltimespentinitself(numberofsamplestimessamplingperiod),andthecallingfunctions.
Foreachcallingfunctionislistedthenumberofcallsandtheproportionofthetotal;thisinformationisobtainedpreciselythroughthecallstomcountwherethecallerisrecordedinthecallcounts.
Theproportionofcallsfromacallerisusedtoestimatethetimespentinthecurrentfunctionbycaller.
Theunderlyingassumptionisthatcallstoafunctiontakethesametimeonaverageirrespectivefromthecaller.
Thisisclearlynotthecaseas,forinstance,afunctiondraw_iconmaycallscale_bitmapsforverysmallimageswhilefunctionscale_backgroundmaycallscale_bitmapsforimages500timeslarger.
Theexecutiontimespentforeachcallerispropagatedtothecallersresursively,startingfromtheleaffunctions.
Thisaddsanotherlistforeachfunctioninthecallgraphreport,thetimespentineachfunction(anditschildren)called.
Thetotaltimespentinthefunctionitselfandallitscalledchildrenisalsopartofthecallgraphreport.
Forrecursivecalls,aseparateentryiscreatedforthecyclewhichlistscallersandcalleesfromousidethecycle;then,entriesformembersofthecyclelistcallersandcalleesfromwithinthecycle.
Gprofandsimilartoolsofferanexcellentcompromiseoflowoverheadanddetailedusuallyreliableinformation.
Itmay,however,beinadequateorevenmisleadinginmoreinvolvedcaseswhere:thetimespentinafunctionisverydifferentdependingonthecaller.
Measuringitadequatelywouldrequiresamplingnotonlythecurrentlyexecutinginstructionaddressbutalsothecallersaddressonthestack,possiblyforseverallevels.
Thecallgraphreportcouldthenshowthetimespentinafunctionbasedonchainsofcallers,butthiswouldbemoredifficulttopresentclearly,andthenumberofsamplesassociatedwitheachchainislikelytobetoosmalltobereliable;thesamplingintervaliscorrelatedwiththeprogramactivity.
Whenaprogramcontinuouslymakesblockingsystemcalls,thereisachancethatthescheduleroftengivescontroltotheprogramandactivatesthevirtualtimerusedforsamplingwhentheprogramisinthesamearea,whichgetsoverrepresentedinthesamples;thetimespentnotexecutingtheprogram,waitingforthediskorforotherprocesses,isofinterest.
Inthatcase,othersourcesofinformationshouldbeusedtoannotatethereportswithinformationabout7timespentwaiting,toobtainthetotalelapsedtime,insteadofjusttheexecutiontime,ineachfunction;moreinformationisrequiredaboutwhytimeisspentineachsection(cachefaults,pagefaults.
.
.
).
#Runtheprogramcompiledwithout-pgandlinkedwith-pg#tomeasurethelowoverheadofsamplingalone.
[gzip-1.
2.
4a]$time.
/gzip.
pg-nomcount/dev/null24.
30user0.
62system0:28.
30elapsed88%CPU#Runtheprogramcompiledandlinkedwithoption-pg#Overheadisslightlylargerbutitprovidescallgraphinfo[gzip-1.
2.
4a]$time.
/gzip.
pg-static/dev/null25.
79user0.
51system0:29.
88elapsed88%CPU#Filegmon.
outisproducedwhentheprogramexits[gzip-1.
2.
4a]$ls-alsgmon.
out188-rw-rw-r--1useruser186366avr1014:07gmon.
out#Usegproftointerpretgmon.
out,usingdebuggingsymbols#informationfromtheexecutablefile[gzip-1.
2.
4a]$gprofgzip.
pg-static>gprof.
out#Lookattheresults,firsttheflatprofilewiththepercentageof#executiontimeforeachfunctionindecreasingorder.
[gzip-1.
2.
4a]$lessgprof.
outEachsamplecountsas0.
01seconds.
%cumulativeselfselftotaltimesecondssecondscallsms/callms/callname27.
137.
537.
5319573.
855.
95fill_window23.
2013.
976.
4416440.
0019205.
66deflate14.
8418.
094.
1219582.
102.
10updcrc12.
1621.
463.
38do_scan8.
3823.
792.
33short_loop3.
7824.
841.
05__mcount_internal3.
1325.
710.
87read.
.
.
#Thenthecallgraph.
Functionupdcrcuses4.
12sandcallsnone.
#Itiscalledfromzipandfile_read.
Functionfile_readis#calledfromlm_initandfill_window.
Itusesaboutnotimebut#callsupdrcforabout4.
12s.
This4.
12sisalmostallattributed#tocallerfill_window(1957/1958calls).
.
.
.
0.
000.
001/1958zip[3]4.
120.
001957/1958file_read[8][7]15.
64.
120.
001958updcrc[7]0.
000.
001/1958lm_init[27]0.
004.
121957/1958fill_window[6][8]15.
60.
004.
121958file_read[8]4.
120.
001957/1958updcrc[7].
.
.
4.
3.
HardwareCountedEventsSamplingwithOprofileOprofile[3]isverysimilartoGprof;itevenproducescompatibleresultsfiles.
Thetwoimportantdifferencesarethatitcollectssamplesbasedonhardwareperformancecountersinterrupts,andthatitoperatesonthecompletesystem(gatheringsamplescontinuouslyforallprogramsexecutingonthe8system).
Hardwareperformancecountersarenowavailableinallpowerfulmodernmicroprocessorsandmaybeusedtocountvariouseventsofinterestincludingclockcycles,L1orL2cachemisses,branches,branchestaken,andpipelinestalls.
Theperiodicsamplingisobtainedbyrequestinganinterruptwhenthecounterreachesacertaincount.
Oprofiledoesnotuseprograminstrumentation(i.
e.
,placingcallstomcountineachfunction).
Thus,norecompilationisnecessaryandtheoverheadislower,butcallgraphreportscannotbegenerated.
Theonlyrequirementisthatdebugginginformationisrequiredtocorrelatetheaddressofsampleswithprogramfunctionsandlinenumbers.
Becauseofitslowoverhead,itisnotuncommontokeepOprofilerunningforextendedperiodsonrunningserversystems.
Thewholesystemprofilingfeatureisparticularlyusefultoseewhichproportionofthetimeisspentineachprogram,thusdiscoveringwhoisusingupalltheresources.
Itisalsousefulwhenasingletaskinvolvingseveralprogramsisexecutedonasystem.
Forexample,whenanalysingthestartuptimeofasophisticatedWebbrowser,itispossibletoseethetimespentinfunctionsinthekernel,thebrowser,thewindowmanager,theXserverandvariousdaemons.
Insomerarecases,theinformationproducedbyhardwareperformancecounterssamplingtoolsmaybebiased.
Indeed,areal-timeprocessusingthesameperiodasthesamplingtoolmayhaveitssamplesgrosslyunderoroverrepresented.
Asimplesolutionistorandomlyvarythesamplingperiodaroundatargetaverage.
#Runtheoprofilegraphicaluserinterface,clicktostartthedaemon[gzip-1.
2.
4a]$oprof_start#Runtheunmodifiedprogram(withdebuggingsymbolspresent)[gzip-1.
2.
4a]$time.
/gzip.
plain/dev/null24.
40user0.
87system0:27.
67elapsed91%CPU#Stoptheprofilingdaemonandextractstatistics[gzip-1.
2.
4a]$oprofpp-l-igzip.
plain>gzip.
oprof#Lookattheresults[gzip-1.
2.
4a]$lessgzip.
oprofCputype:PIICpuspeedwas(MHzestimation):233.
140000Counted"clocksprocessorisnothalted",samplinginterval200000vmasamples%-agesymbolname0804810000_start.
.
.
08050504500.
059034long_loop080504e1680.
0802862limit_ok080504c11110.
131055longest_match080505721600.
188909the_end080505471710.
201896mismatch0804c5509881.
16651ct_tally0804c93011001.
29875send_bits0804c6d012821.
51363compress_block0805aad014651.
7297memcpy0805050d69058.
15259short_loop080505221210114.
2874do_scan0804ea101382116.
3182updcrc0804b4c02140525.
2724deflate0804b1202502029.
5406fill_window94.
4.
SystemCallsTracingusingStraceLinuxandPOSIXsystemsoffertheptracesystemcalltoallowoneprocesstomonitoranotherprocess.
Itisusedbydebuggersandothertoolslikestrace[9].
Whenaprogramisrununderstrace,itisblockedeachtimeitissuesasystemcall.
Thecontrolpassestostracebeforethesystemcall,toextractthevalueofthearguments,thesystemcallisthenperformedasusual,andthecontrolpassestostraceafterthesystemcalltoextractthereturnvalues.
Theoverheadcostisseveralmicrosecondsforeachsystemcall,comparabletohittingabreakpointinadebugger.
However,thenumberofsystemcallsisrelativelylowforCPUboundprocesseslikegzip.
#Tracethesystemcallsissuedduringtheexecution[gzip-1.
2.
4a]$timestrace-s120-f-F-otrace.
/gzip.
plain\/dev/null25.
23user1.
57system0:30.
97elapsed86%CPU#Examinethesystemcalltracefile[gzip-1.
2.
4a]$lesstrace2488execve(".
/gzip.
plain",[".
/gzip.
plain"],[/*44vars*/])=02488fcntl64(0,0x1,0,0xbffff804)=02488fcntl64(0x1,0x1,0x1,0xbffff804)=02488fcntl64(0x2,0x1,0x1,0xbffff804)=02488uname({sys="Linux",node="rocamadour"02488geteuid32()=53632488getuid32()=53632488getegid32()=11052488getgid32()=11052488brk(0)=0x810b3742488brk(0x810b394)=0x810b3942488brk(0x810c000)=0x810c0002488rt_sigaction(SIGINT,{SIG_IGN},{SIG_DFL},8)=02488rt_sigaction(SIGINT,{0x804aaa0,[INT],SA_RESTART|0x4000000},{SIG_IGN},8)=02488rt_sigaction(SIGTERM,{SIG_IGN},{SIG_DFL},8)=02488rt_sigaction(SIGTERM,{0x804aaa0,[TERM],SA_RESTART|0x4000000},{SIG_IGN},8)=02488rt_sigaction(SIGHUP,{SIG_IGN},{SIG_DFL},8)=02488rt_sigaction(SIGHUP,{0x804aaa0,[HUP],SA_RESTART|0x4000000},{SIG_IGN},8)=02488ioctl(1,0x5401,0xbffff6c0)=-1ENOTTY(Inappropriateioctlfordevice)2488fstat64(0,{st_mode=S_IFREG|0644,st_size=64140109,02488read(0,"recid=1,size=8,format=BINARY,event_type=4,facility=LTT,severity=DEBUG,\nuid=dagenais,gid=dagenais,pid=1953,pgrp=".
.
.
,65536)=65536.
.
.
4.
5.
LowOverheadKernelTracingwiththeLinuxTraceToolkitThedataaggregationperformedbythetoolsdiscussedinprevioussectionsisimportanttoobtainalowoverhead.
Thedownsideisthatsomeinformationislostintheaggregates(numberofcallsforeachfunctioninsteadofwhichfunctionwascalledwhenandinwhatorder).
Afulltraceofcollecteddataitemsrapidlyfillsadiskbutdoesnotaprioridiscardinformationthatmaynotseemusefulinitially,butcouldbefoundsolater.
Tracingisusedpervasivelyinsoftwareprojects,fromprintstatementstologgingdaemonslikesyslogdandklogd.
TheLinuxTraceToolkit[4]isextensible.
Itcomeswith60predefinedtracepointsinsertedinthekernel,dividedinto8categorieswhichmaybeenabled/disabledeitheratcompileoratruntime.
MoretracepointsmayeasilybeaddedbyrecompilingthekernelorusingtheDynamicProbescodepatchingsystem[10].
Itskeyfeaturesarelowoverheadandpost-processingtools.
10Lowoverheadisachievedbycarefullyselectingtheinformationtolog,andminimizingcontextswitching.
Sinceallschedulingchangesandsetuidcallsmaybetraced,thereisnoneedtorecordtheprocessoruseridwitheachevent.
Furthermore,mosteventsbeingcloselyspacedintime,32bitstimedifferencesarestoredinsteadoffull64bitsseconds/microsecondsvalues.
Alltheeventsareloggedbyappendingtheirdatatoalargedoublebuffer.
Whenabufferisfull,adaemonaccessesthebufferthroughsharedmemoryandcopiesitscontenttodisk.
Theoverheadoftracingabusysystemamountstolessthan5%fortheelapsedtimeanduptoseveralmegabytesperminuteoftracingdatatostoreondisk[11].
Thetraceanalysisisperformedoffline,tominimizetheoverheadduringdatacollection,andpossiblyonaremotehostwhenstudyingembeddedsystems.
Theinformationcontainedinthetrace(systemcalls,devicesoperations,schedulingchanges)issufficienttoreconstructthesystembehavior(includingwhichfiledescriptorisassociatedtowhichfileormemoryregion)andmaythereforebeusedforseveraldifferentanalyses.
Thetoolsincludedshowtheeventsgraphically,perprocessinatimeline,andcontainperprocesssummaries(executiontime,numberofcallspersystemcall,waittime,bytesread/written).
Newanalysistoolsmaybewrittenusingtheprovidedtracereadinglibrary,orbymodifyingtheprovidedtools.
Indeed,whileitiseasywithLTTtocapturealltheneededrawdata,synthesizingthedesiredhighlevelinformationismorechallenging.
Asatest,amodifiedtraceanalysistoolwasdevelopedtoanswerthefollowingnonobviousquestion:whereisthelargestartingtimeofapplicationssuchasGaleon,MozillaandOpenOfficespent4.
5.
1.
DecomposingtheWaitingTimeTraditionally,systemstatisticsdecomposetheelapsedtimeintousermodeexecutiontime,systemmodeexecutiontime,andwaitingtime.
Profilingtoolsaregoodatdecomposingtheexecutiontimebyfunctionorevensourcecodeline.
Theobjectiveherewasdecomposingthewaitingtimeintowaitingrunnable(waitingfortheCPU)andwaitingnonrunnable(blockedonI/O,orwaitingforaprocessoratimer).
Thisinformationmaybeextractedfromadetailedtrace:SchedulingChangeeventstellthestatusoftheoutgoingprocess(runnableornot).
WakeUpeventschangethestatusofaprocessfromnonrunnabletorunnable.
Iftheeventpriortobeingscheduledoutnonrunnableisareadorapagefaulttrap,theprocessiswaitingfortheassociatedfile.
Atablemustkeeptrackforeachprocessofalltheopenandmmapoperationsassociatingfileswithfiledescriptorsormemoryaddressranges.
Iftheeventpriortobeingscheduledoutnonrunnableisawaitpidcall,theprocessiswaitingfortheassociatedprocess.
Therearecaseswhereaprocessiswaitingforoneofseveralpossiblefilesorprocesses,withcallstowait,select,orpoll.
Inthatcase,thewaitingtimeisattributedtotheprocessorfilewhichcausesthecalltoterminate.
Pollandwaitmayalsoendbecauseofatimeout.
Thewaittimeisthenattributedtothemoregeneralwaitfortimeoutcategory.
Atracewasgeneratedonafreshlyrebootedsystem,withnootheractivity,whilestartinguplargeprogramsoneafteranotherbutwithoutanyoverlap.
ThewaitingtimeforGaleon[12],forinstance,wasdecomposedintoseveralwait-for-fileandwait-for-processcomponents,whichaccountedfor7.
96softhetotal9.
27s.
Theremaining1.
31sismostlywait-for-timeout(0.
89sawaitingamouseclick)and11only0.
42swait-generic.
Thewait-generictimecouldbefurtherreducedbyidentifyingintheirowncategoryothersystemcalleventsinthetrace,inadditiontoread,select,poll,waitpidandwait.
Thewait-generictimeisnonethelessavailablebysystemcallcategory;.
31soutofthe.
42stotalbelongstostatsystemcalls.
#BootwiththeLTTenabledkernelandstarttheLTTdaemon[gzip-1.
2.
4a]$tracedaemon-ts60/dev/tracertrace1.
tracetrace1.
procTraceDaemon:OutputfilereadyTraceDaemon:TracedriveropenTraceDaemon:Tracebuffersare1000000bytesTraceDaemon:Fetchingeipforsyscallondepth:0TraceDaemon:Daemonwilrunfor:(60,0)TraceDaemon:Donemapping/procTraceDaemon:Endoftracing#Analysethetraceoutput[gzip-1.
2.
4a]$tracevisualizer-atrace1.
tracetrace1.
proctrace1.
out#Lookatthetraceanalysis[gzip-1.
2.
4a]$lesstrace1.
out.
.
.
Process(1684,1658):galeon:galeon-bin.
.
.
UserMode:CPU5.
894726Elapsed15.
677299WaitCPU2.
358053WaitFork0.
000002BH811KernelTimer610PacketIn80PacketOut41SchedIn1330TimerExpire136SyscallMode:Elapsed/Calls0.
0003861CPU0.
308954Elapsed5.
119347WaitCPU0.
599823WaitFile-001.
png0.
000453WaitFile-002.
png0.
000346WaitFile-003.
png0.
000213WaitFile-004.
png0.
000216WaitFile-005.
png0.
000430.
.
.
sys_fcntl64Elapsed/Calls0.
0000054CPU0.
000286Elapsed0.
000286Calls53TrapspagefaultElapsed/Calls0.
0003101CPU0.
179146Elapsed2.
444663WaitCPU0.
448110WaitFile-galeon-bin1.
816968BH38Calls7883KernelTimer23PacketIn212PacketOut1PageAlloc78SchedIn459TimerExpire2IRQstimerElapsed/Calls0.
0000118CPU0.
007725Elapsed0.
007725Calls657usb-uhci,eth0Elapsed/Calls0.
0000263CPU0.
003610Elapsed0.
003625Calls138.
.
.
Trapentry1018876582.
807382168413TRAP:pagefault;EIP:0x08068FC7Trapexit1018876582.
80738716847Syscallentry1018876582.
807421168412SYSCALL:execve;EIP:0x080690D7Filesystem1018876582.
807452168427EXEC:galeonMemory1018876582.
807494168412PAGEALLOCORDER:0Memory1018876582.
807569168412STARTPAGEWAITSchedchange1018876582.
807645157919IN:1579;OUT:1684;STATE:2Filesystem1018876582.
807656157920POLL:3;MASK:0Filesystem1018876582.
807662157920POLL:10;MASK:0Filesystem1018876582.
807666157920POLL:4;MASK:0Filesystem1018876582.
807670157920POLL:5;MASK:0Filesystem1018876582.
807675157920POLL:6;MASK:0Filesystem1018876582.
807680157920POLL:13;MASK:0Memory1018876582.
807688157912PAGEFREEORDER:0Memory1018876582.
807699157912PAGEFREEORDER:0Syscallexit1018876582.
80770215797Syscallentry1018876582.
807731157912SYSCALL:gettimeofday;EIP:0x0805816DSyscallexit1018876582.
80773315797Syscallentry1018876582.
807758157912SYSCALL:ioctl;EIP:0x08056F30Thebiggersurprisewasthe3.
5swait-for-CPUsincenothingelsewashappeningonthesystem.
Theanswerliesinasynchronouslycooperatingprocesses.
Indeed,Galeonstartsanumberofhelpersub-processesandusuallyblocksawaitingananswer.
Thisshowsupnicelyinthewait-for-processcategoryalongwiththesub-processid.
However,GaleonisacomplexgraphicalapplicationwhichusestheXwindowserver[5]forgraphicsrendering.
TheXserverisoptimisedtoavoidblockingusingasynchronousinteractionswheneverpossible.
Thisallowsbatchingrenderingoperations,butalsoparallelexecutionwhentheapplicationandtheXserverarerunningonseparateprocessors.
4.
5.
2.
IdentifyingServersWorkingonbehalfofClientsThelastanalysisrefinementwasdecomposingtheexecutiontimeofaserverprocess,labeledCPU,intoCPU-for-Clientcomponents.
Atypicalclientserverrelationshipmaybeidentifiedbythepatternofaserverlisteningonasocket,aclientconnectingtothesocket,andtheserveracceptingtheconnection.
13Theserverandclientthencommunicatebyreadingandwritingtothesocketuntiltherequestisservedandtheservergoesidle.
Theserverthenawaitsnewconnectionsorrequestsfromclientsusingaselectorpollsystemcall.
Assumingthataserver,afteritsinitializationphase,isalwaysworkingonbehalfofaclient,theservergetsintoCPU-for-Clientxwheneveritacceptsaconnectionorreadsfromaconnectiontoclientx.
Thissimpleheuristicproducesinterestingresultsinmanycases.
However,itdoesnotmodelcaseswhererequestsaregrouped.
Forexample,ifnineclientsmakeasynchronousrequestswhicharesimplybufferedbytheserver,andupontherequestfromthetenthclient,allbufferedrequestsareexecuted,thetimespentservingthelastisoverestimated.
Complexinteractionsbetweenclientsandserversareevenmoredifficulttoautomaticallyrecognizeinordertoattributeservingtimeappropriatelytoclients.
Forinstance,GaleonconnectstotheGNOMEconfigurationdaemon,Gconfd,toexpressinterestinanumberofconfigurationparameters,leavingacallbacksocketaddress.
Gconfdthenconnectstothiscallbackaddressandprovidesthecurrentvaluesfortheparameters,andeventuallyupdatestotheseparameters.
GaleonthenappearstobeservingparameterchangerequestsfromclientGconfd.
4.
6.
DiscussionTheLinuxTraceToolkitisoneofthebestsolutionsforindepthlowlevelsystemstudies.
Itiswidelyusedinembeddedandreal-timesystems,andcouldeasilybeusedinoperatingsystemsandreal-timeprogrammingcourses.
Itcouldproveveryusefultodevelopersandsystemadministratorswhenstronginteractionsbetweenapplicationsandtheoperatingsystemareencountered.
ItisstillpendingintegrationinthemainLinuxkernel.
Thus,akernelpatchandrecompilation,oraspecialkernel,arerequiredontopoftheLTTtracingdaemonandtracingtoolspackage.
5.
ConclusionTraditionaltoolslikeGcov,Gprof,andStracehaveexistedforyears,withmanyvariantsintermsofpresentation(graphs,colors,evenanimations)ondifferentplatforms.
Theserepresentmature,simpleandefficientwaystoobtainusefulinformation.
Theappearanceofhardwareperformancecountersinmicroprocessorsinthe1990swastheenablingtechnologyforsamplingtoolslikeOprofileprovidingmoreprecisesamplingandseveraltypesofsamples(cyclecount,cachemisses.
.
.
).
Anotherimportantenablingtechnologyinthefieldofsystemperformanceanalysisisthesourcecodeavailabilityoffreesoftware.
Theprintstatementspreviouslyinsertedbyprogrammersonlyintheirapplicationscannowbeplacedeverywhereinthesystem.
TheLinuxTraceToolkitprovidesthefirst60interestingtracingpoints.
Moreimportantly,itsimplifiestheinsertionofmoretracepointswhichwillenableanumberofsophisticatedanalysistoolsneededtobetterunderstand,studyandimprovecomplexdistributedsystems.
Bibliography[1]FreeSoftwareFoundation,"GNUCompilerCollection",http://gcc.
gnu.
org/.
[2]FreeSoftwareFoundation,"BinaryTools",http://sources.
redhat.
com/binutils/.
[3]JohnLevonetal.
,"Oprofile",http://oprofile.
sourceforge.
net.
[4]KarimYaghmour,"LinuxTraceToolkit",http://www.
opersys.
com/LTT.
14[5]XFree86Project,"TheXFree86Project",http://www.
xfree86.
org.
[6]JamesLarusetal.
,"EEL:AnExecutableEditingLibrary",http://www.
cs.
wisc.
edu/~larus/eel.
html.
[7]FreeSoftwareFoundation,"TheGNUProjectDebugger",http://sources.
redhat.
com/gdb/.
[8]Jean-LoupGailly,"GNUCompressionUtilityGzip",http://www.
gnu.
org/software/gzip/gzip.
html.
[9]WichertAkkermanetal.
,"Strace",http://www.
liacs.
nl/~wichert/strace/.
[10]RichardJ.
Mooreetal,"DynamicProbes",http://www.
ibm.
com/developerworks/oss/linux/projects/dprobes/.
[11]K.
YaghmourandM.
R.
Dagenais,"Measuringandcharacterizingsystembehaviorusingkernel-leveleventlogging",ProceedingsoftheUSENIXAnnual2000TechnicalConference,SanDiego,California,USA,June2000[12]MarcoPesentiGrittietal,"Galeon:theWeb,onlytheWeb",http://galeon.
sourceforge.
net/.
15
- SoftwarePerformanceAnalysis相关文档
- thresholdsts60.com
- standbyts60.com
- Predictionts60.com
- topographicalts60.com
- dBts60.com
- 本公司ts60.com
VPS云服务器GT线路,KVM虚vps消息CloudCone美国洛杉矶便宜年付VPS云服务器补货14美元/年
近日CloudCone发布了最新的补货消息,针对此前新年闪购年付便宜VPS云服务器计划方案进行了少量补货,KVM虚拟架构,美国洛杉矶CN2 GT线路,1Gbps带宽,最低3TB流量,仅需14美元/年,有需要国外便宜美国洛杉矶VPS云服务器的朋友可以尝试一下。CloudCone怎么样?CloudCone服务器好不好?CloudCone值不值得购买?CloudCone是一家成立于2017年的美国服务器...
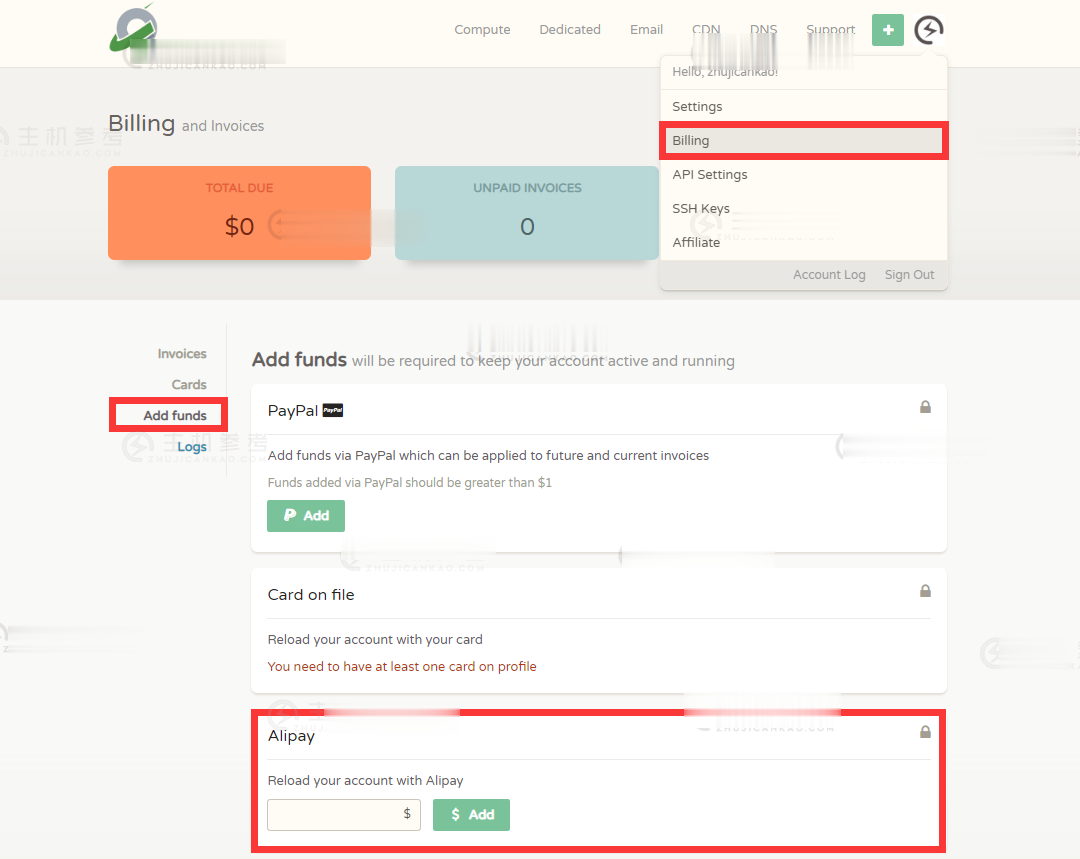
Hostodo:4款便宜美国vps七折优惠低至$13/年;NVMe阵列1Gbps带宽,免费DirectAdmin授权
hostodo怎么样?快到了7月4日美国独立日,hostodo现在推出了VPS大促销活动,提供4款Hostodo美国独立日活动便宜VPS,相当于7折,低至$13/年,续费同价。Hostodo美国独立日活动结束时间不定,活动机售完即止。Hostodo商家支持加密数字货币、信用卡、PayPal、支付宝、银联等付款。Hostodo美国独立日活动VPS基于KVM虚拟,NVMe阵列,1Gbps带宽,自带一个...

亚洲云Asiayu,成都云服务器 4核4G 30M 120元一月
点击进入亚云官方网站(www.asiayun.com)公司名:上海玥悠悠云计算有限公司成都铂金宿主机IO测试图亚洲云Asiayun怎么样?亚洲云Asiayun好不好?亚云由亚云团队运营,拥有ICP/ISP/IDC/CDN等资质,亚云团队成立于2018年,经过多次品牌升级。主要销售主VPS服务器,提供云服务器和物理服务器,机房有成都、美国CERA、中国香港安畅和电信,香港提供CN2 GIA线路,CE...
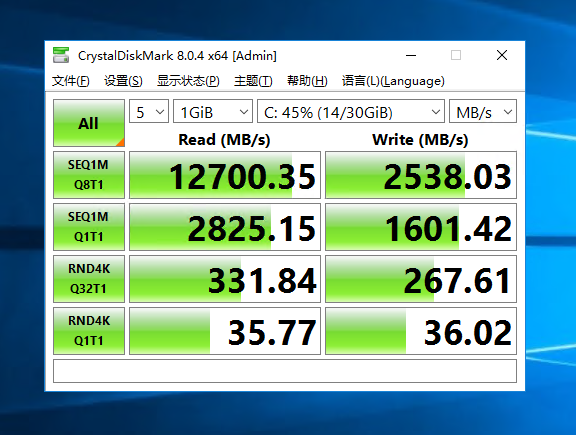
ts60.com为你推荐
-
网罗设计网络设计是什么专业网易网盘关闭入口怎么打开网易网盘??netlife熊猫烧香图片同ip网站查询怎么查自己的服务器挂着哪些网站杰景新特杰普特长笛JFL-511SCE是不是有纯银的唇口片??价格怎样??www.78222.com我看一个网站.www.snw58.com里面好有意思呀,不知道里面的信息是不是真实的lcoc.topeagle solder stop mask top是什么层m88.comm88.com现在的官方网址是哪个啊 ?m88.com分析软件?www.45gtv.com登录农行网银首页www.abchina.com,baqizi.cc曹操跟甄洛是什么关系