connectivity网易轻博客
网易轻博客 时间:2021-01-13 阅读:()
1ElectronicSupplementaryMaterialGeneticAssessmentofEnvironmentalFeaturesthatInfluenceDeerDispersal:ImplicationsforPrion-InfectedPopulationsAmyC.
Kelly,NohraE.
Mateus-Pinilla,WilliamBrown,MarilynO.
Ruiz,MarlisR.
Douglas,MichaelE.
Douglas,PaulShelton,TomBeissel,JanNovakofskiMicrosatelliteMarkersThefollowingmicrosatelliteswereemployedinthisstudy:BM1225,BM4107,CSN3,(Bishopetal.
1994),IGF-1(Kirkpatrick1992),OBCAM(Friesetal.
1993),OarFcb304(Buchananetal.
1993),RT20,RT23,RT27(Wilsonetal.
1997)andSrcrsp-10(Bhebheetal.
1994).
Welabeledforwardprimerswithfluorescentdyes(NED,HEX,FAM)andseparatedmicrosatellitefragmentsonanABI3730XLcapillarysequencer(AppliedBiosystems,FosterCity,CA).
WevisualizedmicrosatellitegenotypeswithGeneMapper(v.
4.
0;AppliedBiosystems,FosterCity,CA).
WeusedMicro-checker(v.
2.
2.
3;VanOosterhoutetal.
2004)toevaluategenotypingerrorsusingexpectedallelefrequenciesderivedunderHardy-Weinbergequilibrium(HWE).
FSTSurfaceProjectionWeusedtheSingleSpeciesGeneticDivergenceoptionwithintheGeneticLandscapesGIS(GeographicInformationSystem)ToolboxtoprojectasurfacefrompairwiseFSTvaluescalculatedbetweenall31studysites.
TheprogramfirstassociatedpairwiseFST2valueswithmidpointsbetweenallstudysitesandanetworkofnearestneighbors.
Spatialinterpolationwasthenperformedusinganinversedistanceweightedinterpolationalgorithmtoestimategeneticdistancesalongagridoverlaidonthestudyarea.
GeneticdistancesforallpointsacrossthegridwereinterpolatedsuchthatmidpointFSTvaluesthatwerespatiallycloserinfluencedtheestimatemoresothanthosethatweredistant.
Moredetailsontheinterpolationprocedurearedescribedinhttp://www.
werc.
usgs.
gov/productdetails.
aspxid=4017.
FRAGSTATSmetricsTheConnectanceIndex(CONNECT)measuresfunctionalconnectivity,meaningthatgridcellsinthedatathatdepictthetargetvariablearenotliterallyadjacent,buttheyareconsideredadjacent(orconnected)withinagiventhresholddistance.
Inthiscase,adjacencywasdefinedascellswithin100mofeachother.
Theuser-defined100mthresholdwasusedtoaccountforpotentialimprecisionofdataclassificationsatfinespatialresolutionsandtoprovideamorerealistic(i.
e.
,functional)depictionofhowdeermightinteractwiththelandscape.
Themetricitselfisapercentage,witharangeof0to100.
Morespecifically,itmeasuresthepercentageoftargetvariableadjacencies(connectionsorjoins)relativetoallpossibleadjacencies.
FormoreinformationontheConnectanceIndexsee:http://www.
umass.
edu/landeco/research/fragstats/documents/Metrics/Connectivity%20Metrics/Metrics/C122%20-%20CONNECT.
htm3ThePatchCohesionIndex(COHESION)isasecondmeasureofconnectivityofalandscapevariable.
Thismetrictakesintoaccountphysicaladjacency(withoutathreshold)incombinationwiththesizeandshapeofthepatches.
Takingforestasanexample,ahigherCOHESIONvaluewouldoccurinalandscapewithlargerandcompactpatchescomparedtoonewithsmallorconvolutedpatches.
FormoreinformationonthePatchCohesionIndexsee:http://www.
umass.
edu/landeco/research/fragstats/documents/Metrics/Connectivity%20Metrics/Metrics/C121%20-%20COHESION.
htmTheClumpinessIndex(CLUMPY)isametricindicatinghowcontiguousordispersedaretheadjacentpatchesofalandscapevariable.
AhighervalueofCLUMPYwouldoccurifseveralpatcheswerelocatedclosetogetherratherthanbeingmoreuniformlydistributed.
FormoreinformationontheClumpinessIndex(CLUMPY)seehttp://www.
umass.
edu/landeco/research/fragstats/documents/Metrics/Contagion%20-%20Interspersion%20Metrics/Metrics/C115%20-%20CLUMPY.
htmThePerimeter-AreaFractalDimension(PAFRAC)isashapemetricdeterminedacrossarangeofspatialscales.
PARFRACislowforpatcheswithsimpleperimetersandincreasesforpatchshapeswithhighlyconvolutedperimeters.
FormoreinformationonthePerimeter-AreaFractalDimensionIndex(PAFRAC),seehttp://www.
umass.
edu/landeco/research/fragstats/documents/Metrics/Shape%20Metrics/Metrics/C23%20-%20PAFRAC.
htm.
Multivariatelinearregressionanalysis4DescriptionandsourceoflandscapevariablesincludedinmultivariateregressionanalysisarelistedinTableS1.
Topreventoverlyinfluentialobservationsfrombiasingourmodels,weusedleveragescores,Cook'sDvalues,andstandardizedinfluencevaluestoidentifyoutliers(Kieetal.
2002;ChatterjeeandHadi2009;Anlaufetal.
2011).
Leveragescoresidentifyobservationsthatresultinlargechangesinregressionlinefitupontheirdeletion.
Wecalculatedleverage(pi)accordingtoChatterjeeandHadi(1986)andconsideredobservationsoverlyinfluentialwhenpi>2p/N(p=numberofindependentvariablesinthemodel;N=numberofobservations).
Cook'sDvalueswerecalculatedaccordingtoCook(1977)andcomparedtoanFdistributionwithα=0.
05and(N-p)degreesoffreedom.
AllCook'sDvalues>thecriticalFvaluewereconsideredoverlyinfluentialandremovedfromthemodel(Cook1977).
LeveragescoresandCook'sDallowedustodeterminetheeffectsofoutliersontheoverallmodel,butstandardizedinfluencevalues(DFFITS)allowedustoexaminetheinfluenceofeachobservationonitspredictedvalue.
WecalculatedDFFITSaccordingtoChatterjeeandHadi(1986)andeliminatedobservationsyieldingvalues>2)/(Np(ChatterjeeandHadi1986).
Usingthesethreecriteria,weidentifiedthirteenobservationsoutof465(2.
8%)thatwereoutliersandafterstringentlyevaluatingtheirbasis(Motulsky2010),weomittedthemduringfurtheranalyses.
Themajorityoftheoutliersremoved(7/13)involvedstudysitesthathadrelativelylowsamplesizes.
Threeofthirteenoutliersinvolvedpairwisecomparisonswithstudysite27,thoughtheremainingtenoutliersappearedtoinvolvestudysitesthatwererandomlydistributedgeographically.
AsingleoutlierhadthehighestFSTvalueobserved,thoughtheremainingoutliersdidnotexhibitunusuallyhighorlowFSTvaluesascomparedtotherestofthe5dataset.
WecomparedvaluesofdependentvariablesofoutlierstovaluesfortherestofthedatabyexaminingboxplotsandplottingdependentvariablesagainstFSTvalues(datanotshown).
Trendsinthedistributionofvaluesfordependentvariablewerenotapparentinoutliersascomparedtotherestofthedata.
Whentwoormorelandscapevariableswerehighlycorrelated(Pearson'srP>0.
7),thepredictorwiththelowestpartialcorrelationinthefullmodelwasremoved.
RemovinglandscapevariableswithrP>0.
7(n=7)resultedinagenerallackofcollinearityamongpredictorsasdeterminedbyvarianceinflationfactors.
CorrelatedpredictorsthatwereremovedfromthemodelarelistedinTableS2.
Weusedvarianceinflationfactors(VIF)toevaluatetheincreaseinvarianceforestimatedregressioncoefficientsresultingfromcollinearpredictors,withVIF>10indicativeofhighmulticollinearity(Kutneretal.
2004).
Afterremovinghighlycorrelatedvariables,wecalculatedvarianceinflationfactorsforindependentvariablesandfoundthatthevarianceofestimatedregressioncoefficientswasnotsubstantiallyincreasedbycollinearpredictorsasVIFvaluesforallpredictorswere0.
7thatweresubsequentlyremovedfromthemodel.
VariableCorrelateDirectionofCorrelationVariableRemoved*%GrasslandSlope+%GrasslandForestCONNECTDevelopedCONNECT+ForestCONNECT%GrasslandGrasslandCONNECT-%GrasslandForestCONNECTGrasslandCONNECT+ForestCONNECTForestCONNECTWaterCONNECT+ForestCONNECTAgricultureCLUMPY%Agriculture-AgricultureCLUMPY%RiparianSlope+Slope%GrasslandForestCLUMPY-%GrasslandForestCONNECTDistance-ForestCONNECTSlopeGrasslandCOHESION+SlopeDevelopedCONNECTGrasslandCONNECT+DevelopedCONNECTGrasslandPAFRACSlope+SlopeDevelopedCONNECTWaterCONNECT+DevelopedCONNECT%GrasslandAgricultureCLUMPY-%Grassland%GrasslandAgriculturePAFRAC+%GrasslandDistanceDevelopedCONNECT-DevelopedCONNECTForestCONNECTWaterCONNECT+ForestCONNECT%AgricultureAgricultureCOHESION+AgricultureCOHESIONWaterCOHESIONWaterCLUMPY+WaterCLUMPY*thepredictorwiththelowestpartialcorrelationinthefullmodelwasremoved.
10TableS3.
Percentsignificant(P<0.
05)localr,rangeoflocalr,andmeanlocalrforfive,15and25nearestneighborsingroupsofwhite-taileddeerinnorthernIllinois(NIL),DuPageCounty(DuP),andWisconsin(WI).
GroupNumberofNearestNeighbors51525%P<0.
051MaxrMeanr%P<0.
051MaxrMeanr%P<0.
051MaxrMeanrAdultMales5.
70.
160.
134.
40.
110.
087.
90.
080.
06MaleYearlings7.
00.
280.
1711.
60.
180.
0914.
10.
120.
06MaleFawns9.
30.
190.
1511.
30.
090.
078.
20.
060.
05AdultMalesandFemaleYearlings6.
40.
270.
147.
60.
120.
088.
10.
090.
06AdultFemales14.
70.
320.
1618.
80.
240.
0920.
50.
150.
07FemaleYearlings5.
70.
160.
124.
80.
110.
074.
80.
070.
05FemaleFawns17.
10.
240.
1415.
20.
130.
0919.
50.
090.
06AdultFemalesandFawns16.
00.
310.
1622.
80.
230.
1024.
50.
190.
081NumberofautocorrelationcoefficientsthatweresignificantatP<0.
05dividedbythetotalnumberautocorrelationcoefficientscalculatedforeachgroup*100.
Includingonlysignificantlocalrvalues.
- connectivity网易轻博客相关文档
- 香港网易轻博客
- multiple网易轻博客
- 金融服务外包动态
- x2100网易轻博客
- 意象网易轻博客
- descriptive网易轻博客
SugarHosts糖果主机商更换域名
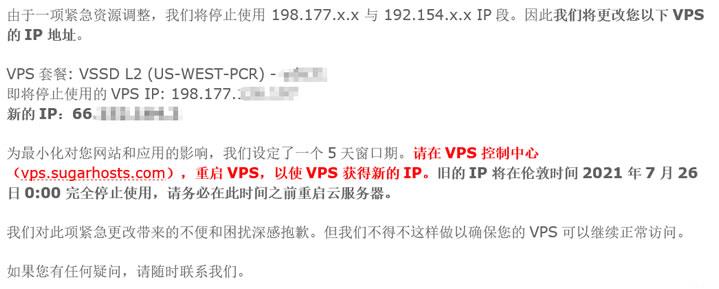
昨天,遇到一个网友客户告知他的网站无法访问需要帮他检查到底是什么问题。这个同学的网站是我帮他搭建的,于是我先PING看到他的网站是不通的,开始以为是服务器是不是出现故障导致无法打开的。检查到他的服务器是有放在SugarHosts糖果主机商中,于是我登录他的糖果主机后台看到服务器是正常运行的。但是,我看到面板中的IP地址居然是和他网站解析的IP地址不同。看来官方是有更换域名。于是我就问 客服到底是什...
华纳云新人下单立减40元/香港云服务器月付60元起,香港双向CN2(GIA)
华纳云(HNCloud Limited)是一家专业的全球数据中心基础服务提供商,总部在香港,隶属于香港联合通讯国际有限公司,拥有香港政府颁发的商业登记证明,保证用户的安全性和合规性。 华纳云是APNIC 和 ARIN 会员单位。主要提供数据中心基础服务、互联网业务解决方案, 以及香港服务器租用、香港服务器托管、香港云服务器、美国云服务器,云计算、云安全技术研发等产品和服务。其中云服务器基于成熟的 ...

RepriseHosting:$27.97/月-L5640,16G内存,1TB硬盘,10TB月流量,西雅图机房
RepriseHosting是成立于2012年的国外主机商,提供独立服务器租用和VPS主机等产品,数据中心在美国西雅图和拉斯维加斯机房。商家提供的独立服务器以较低的价格为主,目前针对西雅图机房部分独立服务器提供的优惠仍然有效,除了价格折扣外,还免费升级内存和带宽,商家支持使用支付宝或者PayPal、信用卡等付款方式。配置一 $27.97/月CPU:Intel Xeon L5640内存:16GB(原...

网易轻博客为你推荐
-
域名注册com如何申请域名后缀是.com的官方网站?网络域名注册如何注册网络域名国际域名国内域名和国际域名的区别me域名注册什么是ME域名,为什么注册ME域名虚拟主机购买虚拟主机需要购买吗?我想自己做个网站,只买了域名了,请问还需要怎么做呢?asp主机空间asp空间是什么免费虚拟主机申请找免费好用的虚拟主机申请地址,云服务器租用谁知道租用服务器、云主机去哪里租?服务器租用费用价格是多少呀香港虚拟空间香港虚拟空间 好不、现在还有人买嘛虚拟主机管理系统虚拟主机管理系统那一家好?