analyseslinpuslite
linpuslite 时间:2021-03-28 阅读:()
ImageStudioLiteTutorialGuideImageStudioAnalysisSoftwareVersion4.
0NoticeTheinformationcontainedinthisdocumentissubjecttochangewithoutnotice.
LI-CORMAKESNOWARRANTYOFANYKINDWITHREGARDTOTHISMATERIAL,INCLUDING,BUTNOTLIMITEDTOTHEIMPLIEDWARRANTIESOFMERCHANTABILITYANDFITNESSFORAPARTICULARPURPOSE.
LI-CORshallnotbeliableforerrorscontainedhereinorforincidentalorcon-sequentialdamagesinconnectionwiththefurnishing,performance,oruseofthismaterial.
Thisdocumentcontainsproprietaryinformationthatisprotectedbycopy-right.
Allrightsarereserved.
Nopartofthisdocumentmaybephotocopied,repro-duced,ortranslatedtoanotherlanguagewithoutpriorwrittenconsentofLI-COR,Inc.
PrintingHistoryPublicationNumber977-14412March2014LI-COR,Odyssey,MPX,In-CellWestern,andMousePODtrademarkscontainedintheSoftwareProductaretrademarksorregisteredtrademarksofLI-COR,Inc.
intheU.
S.
andothercountries.
Thirdpartytrademarks,tradenames,andproductnamesmaybetrademarksorregisteredtrademarksoftheirrespectiveowners.
Youmaynotremoveoralteranytrademark,tradenames,productnames,logo,copyrightorotherproprietarynotices,legends,symbols,orlabelsintheSoftwareProduct.
ThisEULAdoesnotauthorizeyoutouseLI-COR'soritslicensors'namesoranyoftheirrespectivetrademarks.
LI-CORisanISO9001registeredcompany.
2014LI-CORInc.
Allrightsreserved.
Specificationssubjecttochange.
MacintoshandMacaretrademarksofAppleInc.
,registeredintheU.
S.
andothercountries.
WindowsandWindowsVistaareregisteredtrademarksofMicrosoft,Inc.
intheU.
S.
andothercountries.
Forpatentinformation,visitwww.
licor.
com/patents.
4647SuperiorStreetP.
O.
Box4000Lincoln,Nebraska68504USATechnicalSupport:800-645-4260NorthAmerica:800-645-4267International:402-467-0700402-467-0819LI-CORGmbH,Germany(ServingEurope,Africa,andtheMiddleEast):+49(0)61721717771LI-CORUKLtd.
,UK(ServingUK,Ireland,andScandinavia):+44(0)1223422104Forothercountries,contactLI-CORBiosciencesoralocaldistributor.
www.
licor.
com-3-TableofContentsGettingStarted7InstalltheSoftware7Windows7,8,or8.
1OperatingSystems7Installingviadownload:7MacintoshComputers7Installingviadownload:7SetupaWorkArea8OptionalKeyTips8ImageFiles11ImportanImage11ExportAcquisitionDataandImages12ImageDisplay15ViewtheImage15Display15AdjusttheImageAppearance17Features18ViewMode18SlideShow18Create19CroptheImage21Print/ExportArea22DataAnalysis23AddandManipulateShapesManually23ProfilesTab25AutoAdjust26SubtracttheBackground27SubtractaUser-DefinedBackground27Show28Concentration28AnnotatetheImage29Tables31-5-ImagesTable31AddorRemoveaColumn32AddCustomColumns33PasteDatainaColumn33PasteDatafromaSpreadsheettoaColumn33CopyDatatoaSpreadsheet34SortbyColumn34FiltertheTableManually34FilterbyColumn35FormoreFilterOptions…35ViewtheShapesTable35ExportingData36SaveFile36LaunchSpreadsheet36Print36Options37Reporting39PrintanImage39CreateaLabBookPDF39PrintaLabBook41CreateaChart41-6-GettingStartedInstalltheSoftwareIMPORTANT:Youmustbeloggedinusinganadministratoraccount.
Ifneces-sary,logoutandlogbackinusinganAdministratoraccount.
Note:Gotowww.
licor.
com/isliteandclicktheSupportMaterialstabtofindthefreesoftware.
Windows7,8,or8.
1OperatingSystemsInstallingviadownload:1.
Downloadanddouble-clicktheWin_ImageStudioLite_4.
x.
exefileonyourcomputer.
2.
ClickNextandfollowtheinstructionsintheSetupWizard.
MacintoshComputersInstallingviadownload:1.
GotoyourMacSystemPreferencesandclickSecurity&PrivacytoopentheSecurity&Privacywindow.
2.
Clickthelockinthebottomleftcornerofthewindowtoallowediting,ifnecessary.
3.
UndertheGeneralTab,clickMacAppStoreandidentifieddevelopersundertheAllowapplicationsdownloadedfromoption.
4.
Download,anddouble-clicktheMacImageStudioLite_4.
x.
dmgfileonyourcomputer.
5.
ClickAgreetoacceptthelicenseagreement.
6.
Toinstall,dragtheImageStudioiconintotheApplicationsfolder7.
OpentheImageStudioApplicationbydouble-clickingtheImageStudioicon.
-7-GettingStarted8.
Ifawindowappearsthatsays"ImageStudio.
appisanapplicationdown-loadedfromtheinternet.
Areyousureyouwanttoopenit"clickOpen.
SetupaWorkAreaThefirsttimeyoustartthesoftwareyouwillneedtocreatethefirstWorkArea.
TheWorkAreaisafolderontheharddriveornetworkwherealloftheimages,analysesandsettingsarestored.
ClickCreateNew…intheSetActiveWorkAreadialogboxtoopentheCreateNewWorkAreadialogbox.
HereyoucannamethefolderforthenewWorkAreaandbrowsetoalocationontheharddriveornetworkwhereitwillreside.
ThisfolderwillnowappearintheAvailableWorkAreaswindoweachtimethesoftwareisopened.
SelectthefolderandclickOKtosetitastheWorkArea.
(ToremoveaWorkAreafromthewindow,selectitandclickRemovefromList.
Removingthefolderfromthewindowdoesnotdeletethefolderoritscontents.
)Note:EachusershouldcreatetheirownWorkArea,astheprevioussettingsforanalysis,imagedisplay,etc.
fromthelastsessionwillbeappliedtothenextses-sioninthesameWorkArea.
OptionalKeyTipsActivateKeyTipstousethekeyboardtoaccesstheribbontabsandotherfea-turesoftheImageStudiosoftware.
PressAlt(alt/optionkeyonMaccomputers)todisplaytheKeyTipsforallribbontabsandapplicationquicklaunchbuttons.
Presstheletterkeynexttotheapplicationquicklaunchbuttonstoselectthatapplication(e.
g.
press'H'toopentheAnalysistab,asshownbelow).
-8-GettingStartedPresstheletterkeynexttotheribbontabstoviewtheribbonfortheselectedtabandthekeytipsforthecommandsonthatribbon.
Presstheletterkeynexttothecommandstoactivatethecommandsoropenanothermenu.
ForKeyTipswithtwoletters,pressthekeyssequentiallyonthekeyboard.
Inthismanual,instructionsrefertoselectingtabsandcommandswiththemouse.
PressAltatanytimetousetheKeyTipstoselectthetabsandcommandswiththekeyboard.
-9-ImageFilesImportanImageTutorialimagesareprovidedatwww.
licor.
com/isliteintheSupportMaterialstab.
ThefoldernamefortheWesternImageis'9999999_01'.
Followtheseinstruc-tionstoopentheimage.
1.
Downloadtheimagetoyourcomputer.
2.
ClicktheApplicationMenuButtonandhoveroverImport.
HoveroverImageStudioandclickZipFile.
3.
Browsetothe'9999999_01'folder.
ClickOpentodisplaytheimage.
-11-ImageFiles4.
TheimageopensandthefileappearsintheTable.
ExportAcquisitionDataandImagesIntheImagesTable,clickonarowtoselectanimageacquisition.
Toselectmul-tipleimageacquisitions,dragovertherowsorpresstheCtrlkeyonthekeyboardandclickeachrowtoselectit.
ClicktheImageStudioApplicationButtonandhoveroverExporttoviewtheExportimageandanalysisdatamenu.
-12-ImageFiles1.
Tosavetheimageacquisition,clickImageStudioandchooseFolderorZipFile.
ClickZipFiletosavetheimageacquisition(s)asacompressed(zip)file.
Eitherchoiceopensawindowwhereyoucanselectthefoldertowhichtosavetheimageacquisition.
Note:YoucansaveimageacquisitionstoanotherWorkAreaorcreateazipfiletosharewithanotherImageStudiouser.
2.
Tosavetheimagetoagraphicsfile,clickSingleImageViewtoviewachoiceofCurrentImage,SelectedImagesinImagesTable,orColorBarOnly.
Eachchoiceopensawindowwhereyoucanselectthefolder,thefiletype(TIFF,PNG,orHighQualityJPEG),andresolution.
Note:Imagessavedasthesefiletypes(TIFF,PNG,orHighQualityJPEG)areforpresentationpurposesandshouldnotbeusedforfurtheranalysis.
3.
TosaveatiledimagefilefromimagesintheTable,clickMultipleImageViewtoopenabrowsewindowwhereyoucanselectthefolder,thefiletype(TIFF,PNG,orHighQualityJPEG)andresolution.
Note:YoucanquicklyandeasilysavethedataintheTablestoaspreadsheet.
RefertoExportingDataintheTableschapter.
-13-ImageDisplayViewtheImageClicktheImageribbontabtodisplaytheImageribbon.
IntheZoomgroupclickthemagnifiericonstoenlargeorreducethedisplayedimage.
Youcanalsoscrollthemousewheelorusethescrollfunctionofakeypadtozoominorout.
DisplayTheChooseDisplayandAdjustDisplayAssistantsarealternatewaystoadjusttheimagedisplay.
ClickChooseintheDisplaygroupandselectthe800channeltoopentheChooseDisplayAssistant.
Clicktheviewwiththebestdisplay.
TheAdjustDisplaydialogwillopenforfur-theradjustment.
-15-ImageDisplayClickAdjustintheDisplaygroupandselectthe800channeltoopentheAdjustDisplayAssistant.
SelectSignalatthebottomlefttoadjustthemaximumpointonthecurve,Back-groundtoadjusttheminimumpoint,orMidtonestoadjusttheKvalue.
ClickDim-merorBrightertochangethevisualappearanceoftheimage.
Whenfinished,clickDone.
-16-ImageDisplayAdjusttheImageAppearanceTheDisplaytabisontherightsideofthescreen.
Youcanadjusttheimageappearancebydraggingslidersorpointsonacurveforeachchannelacquiredfortheimage.
1.
ClicktheDisplaytabtovieweithersliderbarsorhistogramsoverlaidwithacurve.
Tohidethisview,clickthedoublearrowsinthetoprightcorner.
2.
ClickCurvesatthetoprighttotogglebetweenBrightness/ContrastslidersandCurves.
WhenCurvesishighlighted,ahistogramofoverlaidwithacurveisshown.
3.
Clicktheappropriatecoloredbuttonabovethegraphtoselectadifferentcolorschemeforeachchannel,ortodisableaspecificchannel.
Note:Multiplechannelscanbeviewed,printed,andexportedingrayscale.
4.
ToadjusttheintensityoftheimageintheBrightness/Contrastview,clickanddrageachslider.
5.
Toadjusttheintensityoftheimageinthehistogramview,-17-ImageDisplaya.
Dragtheleft(min)dotoneachgraphtoadjustthelowerthresholdofpixelvaluesthatwillshadetothesamecolorontheviewedimage.
Shadingthelowerintensitypixelstothesamecolorwillcreateavisuallycleanerbackgroundontheimage.
b.
Therightmost(max)dotoneachgraphadjuststheupperthresholdofpixelvaluesthatwillshadetothesamecolorontheviewedimage.
c.
ClickanddragthemiddledotoneachgraphverticallytochangetheKvalue.
Note:Changingthevisualimagewillnotchangethedatacollectedforthatimageorthequantificationofthatdata.
Itonlychangesthemappingofrawimagepixelstodisplaypixels.
6.
FurtherexplanationcanbefoundintheonlineHelpsystembyclickingthequestionmarknexttotheCurvesbutton.
FeaturesClickFeaturesatthetoprighttotogglebetweenshowingandhidingfeaturesontheimage.
Featuresincludetext,arrows,lanemarkers,shapes,andotheritems.
WhenFeaturesishighlighted,theseobjectsappearontheimageandinallexportsoftheimage.
ClickFeaturestohidetheseobjectsfromtheimageandallexportsoftheimage.
Tohidetheseitemsindividually,opentheAnalysisribbonanddisablethecheckboxnexttotheitem(s)intheShowgroup.
ViewModeSelectSingleintheViewModegrouptoviewandanalyzeasingleimage.
ClicktheShowMultipleImagesbuttonandselectthenumberofimagestoviewfromthedrop-downmenu.
Note:YoucannotanalyzeanimageinMultipleImageView.
SlideShowClickStartandtheimagesintheTablewillappearinthewindowsequentially.
ClickStoptoreturntonormalviewing.
Clickthearrow(>)ontheSlideShowgrouptoopentheSlideShowParametersmenu.
ChoosetodisplaytheimagesintheTableandstopattheend,orreturntothebeginningofthetableandcontinuedisplayingtheimages(Loopcontinuously).
Adjusttheslidertomodifytheamountoftimeeachimageisdisplayed.
-18-ImageDisplayCreateClickabuttonintheCreategrouptocreateanewimageacquisitionfilewiththedesignatedactionapplied.
Theoriginalimageacquisitionremainsunchanged.
ClickDuplicatetocreateacopyoftheimage.
ClickRotateorFliptoopentheRotateorFlipOptionsmenuandselectanorientation.
-19-ImageDisplayClickFreeRotatetoopentheFreeRotateOptionsdialogboxandclickthearrowbuttonstorotatetheimageclockwiseorcounterclockwise.
Warning:Freerota-tionschangetheimagedataforthenewimageandmayaffectquantificationres-ults.
ClickReduceNoisetoopentheReduceNoiseOptionsdialogboxandselectanoption.
Hoverovereachoptiontoopenatooltipexplainingthemethod.
ClickOK.
Warning:Reducingnoisechangestheimagedataforthenewimageandmayaffectquantificationresults.
-20-ImageDisplayClickAlignChannelstoopentheAlignChannelsmenu.
Selectonechannelasthestaticreferenceandadjusttheotherchannelusingthearrowbuttons.
ClickOK.
CroptheImageClickCroptocreateanimagethatcontainsonlytheareawithintheboundingbox.
Adjustthecropareabydraggingtheboxesinthecornersoratthecenter.
ClickOKtocroptheimage.
-21-ImageDisplayPrint/ExportAreaPlacecropmarksontheimagetoindicatetheareaoftheimagetoprintorexport.
Thesecropmarkscanapplytotheselectedimage,orallimagesintheImagestable.
1.
ClickApplyandmarksindicatingthecornersofthecroppedareaappearontheimage.
2.
ClickModifytoopentheModifyImagePrint/ExportAreadialog.
Twoboxesappearasdottedlinesontheimage.
3.
Dragthesmallboxinthemiddleoftheimagetocenterthecropmarks.
Dragthecornersofthelargeboxtosurroundtheareaoftheimagetoprintorexport.
4.
ClickCurrentImagetomarkthisimagewiththesecropmarksandclickOK.
Smallcropmarksindicatingthecornersofthecroppedareaappearontheimageatthenewlocation.
Note:IfImagesinimagestableisselected,thiscropdefinitionappliestoallimagesintheImagesTable.
Note:SmallcropmarksappearontheimageaslongasApplyisselected.
Thecropareawillapplytoanyprintorexportaction.
Toremovethesmallcropmarksandprintorexportthefullimage,clickApplyagaintotoggleitoff.
YoucanchangethecolorofthecropmarksbyclickingEditColorintheModifyImagePrint/ExportAreadialog.
-22-DataAnalysisAddandManipulateShapesManually1.
ClicktheAnalysistabtoopentheAnalysisribbon.
SettheAnalysisTypetoManual.
2.
ClickAddRectangletoaddarectangletotheimageorAddEllipsetoaddanellipse.
Clickinthecenteroftheanareaoffluorescencetoplacetherect-angleorellipsearoundit.
Afteraddingthedesiredshapes,clickSelectorpresstheEsckeyonyourkeyboardtoreturnthecursortotheselectiontool.
Note:Shapesareaddedtoallselectedchannels.
Toaddshapestoonlyonechannel,makesureitistheonlychannelselectedintheDisplaypanelontheright.
3.
Tomoveorresizeashape,firstselecttheshapebyclickingonitonce.
Dot-tedlinesindicatetheshapeisselected.
a.
Tomovetheshape,dragthefour-pointedcursorwithintheselec-tionshape.
b.
Toresizetheshape,hoveroveranycornerorsideoftheshape.
Dragthedouble-sidedyellowarrowtoresize.
-23-DataAnalysisNote:Tofindthedouble-sidedyellowarrow,thecursormustbeontheselectiontool(clickSelectintheShapesgrouporpushtheEsckeyonthekeyboard).
Youmusthaveonlyonechannelselectedtores-izeashape.
DisableallchannelsexceptthedesiredchannelintheDisplaypanel.
c.
Toviewtheshapesandlabelsontheimage,enabletheShapesandLabelscheckboxesintheShowgroup.
Disablethecheckmarkstohidetheshapesandlabelsfromtheimage.
Note:YoucanalsoclickFeaturesonthetopleftoftheDisplaytabtotogglebetweenshowingallfeaturesandhidingallfeatures.
d.
Toeditthelabel,clicktheShapestabatthebottomofthescreentoviewtheShapesTable.
UnderthecolumnName,double-clickonthecellforthisshapeandeditthetext.
PressEnteronthekeyboardandthenewtextwillappearontheimage.
Note:YoumustpressEnterorclickonanothercellintheTabletosavethechangetotheTablecellbeforesavingtheacquisition.
e.
Tochangethelocationofthelabel,right-clicktheselectedshapeandhoveroverLabelLocation.
Clickthenewpositionforthelabel.
f.
Tochangethelocationofthelabelfornewshapes,clickthesmallarrowontheShowgrouptoopentheImageViewLabelsmenu.
Youcanalsoadjusttheangleofthelabelandselectthequantificationvaluetodisplay.
-24-DataAnalysisNote:SelectDrawRectangle,DrawEllipse,orDrawFreehandtomanuallydrawShapes.
Dragthemousetocreatetheshape.
Theresultingshapecanbemovedorresizedinthesamewaythatanautoshapeismovedorresized.
4.
Toquicklyaddshapesinoneormorechannels,usetheAddSelectiontool.
a.
Dragarectanglearoundtheshapestoselectthem.
Dottedlinesindic-atetheshapesareselected.
b.
ClickAddSelectionintheShapegroup.
c.
Clicktheimagetoaddtheshapestotheimage.
d.
Tomovetheshapes,dragthefour-pointedcursorthatappearswithineithershape.
Theselectedshapesmovetogether.
5.
Torotateshapesinoneormorechannels,usetheRotatetool.
a.
Dragarectanglearoundtheshapestoselectthem.
Dottedlinesindic-atetheshapesareselected.
b.
ClickRotateintheEditgrouporright-clickontheimageandselectRotatefromthepop-upmenu.
c.
Clickthebuttonsinthepop-upmenutorotateclockwiseorcoun-terclockwise.
ClickZerotoreturntotheoriginalorientation.
d.
Youcanalsorotateshapesbyselectingthem,pressingtheCtrlkeyonthekeyboard,andscrollingwiththemouse.
ProfilesTab1.
Select'Shape2'byclickingontheshapewiththeselectionarrowuntilitchangestoadashedline.
2.
Ontherightsideofthescreen,clicktheProfilestabtoviewtwographsofthepixelswithinaselectedshape.
Thetopgraphisacrosssectionofthe-25-DataAnalysispixelintensitiesfromtoptobottom.
Thebottomgraphisacrosssectionofthepixelintensitiesfromlefttoright.
3.
Adjustthesizeof'Shape2'bydraggingthearrowsonthecornersoftheshape.
Noticehowthegraphchanges.
Note:Thesmallblackmarksindicatetheboundariesoftheshape.
Movetheshapearoundthebandsothatthesmallblackmarksareclosetotheedgesofthepeaktocapturetheentiresignalforthatband.
AutoAdjustThesoftwaremovesselectedshapestofullyencloseareasoffluorescenceneartheshapes.
1.
Dragarectanglearoundtheshapestoselectthem.
Dottedlinesindicatetheshapesareselected.
2.
ClickAutoAdjustandtheshapeswillmoveslightlytobetterenclosenearbyareasoffluorescence.
-26-DataAnalysisSubtracttheBackgroundSubtractthebackgroundoftheblotorgelfromtheshapestoobtainconsistentdata.
ThesoftwarewillnotcalculateSignalfortheshapesifabackgroundmethodisnotselected.
1.
ClickthefirstbuttonintheBackgroundgroupandselectMedianfromthedrop-downmenutosubtractthemedianvalueofthepixelsintheback-groundsegment.
Thismethodisusefulifthepixelintensitiesintheback-groundsegmentarenotuniform.
Note:SelectAveragefortheBackgroundMethodtosubtracttheaveragevalueofthepixelsinthebackgroundsegment.
2.
Inthepop-upwindowsettheBorderWidthto3andselectRight/Lefttoselectthesegmentsontheleftandrightsidesoftheshapeforthistutorial.
3.
ClickSave.
Note:TheblacklineintheProfilesindicatesthebackgroundthatwillbesub-tracted.
SubtractaUser-DefinedBackgroundAregionoftheimagecanbechosenforthebackground.
1.
ClickthefirstbuttonintheBackgroundgroupandselectUser-Definedfromthedrop-downmenu.
-27-DataAnalysis2.
Usingwhatyou'velearnedfromAddandManipulateShapesManuallyinthischapter,placeashapeontheimageintheregionthatyouhavechosenasthebackground.
3.
Selecttheshapebyclickingonitwiththeselectionarrowsotheshapeout-linebecomesadashedline.
4.
ClickAssignShapeintheBackgroundgroup.
ShowIntheShowgroup,enableallcheckboxes,indicatingallitemswillappearontheimage.
Tospecifythelocationofthelabels,clickonthearrowatbottomrighttoopentheImageViewLabelsmenu.
ConcentrationYoucanassignconcentrationvaluestotwoormoreshapesorBandsandtheImageStudiosoftwarewillassignavaluetotheothershapesorBandsbasedontheirrelativeSignal.
1.
ClicktheShapestabatthebottomofthetabletoopentheShapesTable,ifnecessary.
AddConc.
Std.
andConcentrationtotheShapesTablebyclick-ingColumnsandenablingthecheckboxesandclickingSave.
2.
Double-clicktheConc.
Std.
cellforshape1andenter1.
3.
Double-clicktheConc.
Std.
cellforshape4andenter9.
4.
ClicktheConcentrationtabontherightsideofthescreentoviewtheassignedconcentrationstandards.
-28-DataAnalysis5.
ClickthedownarrowunderInterpolationMethodandclickLinearfromthedrop-downmenutoassignalinearinterpolation.
6.
YoucanseetheconcentrationvaluesassignedtoShapes2and3intheConcentrationcolumnintheShapesTable.
AnnotatetheImageClicktheAnnotationtabtoopentheAnnotationribbon.
Hereyoucanchoosethefonttype,size,andcoloroftext.
Youmustselectthetextfirsttochangeitsfonttype,size,orcolor.
Dragaboundingboxaroundexistingtexttoselectit.
1.
ClickAddTextintheTextgroupandclickontheimage.
TypethedesiredtextintheText:box.
ClickOKtoaddthetexttotheimage.
2.
ClickAddArrowandclickontheimagetoaddanarrowtotheimage.
ClickSelectorpresstheEsckeyonthekeyboardtotogglethecursorbacktotheselectiontool.
Clickthetextorarrowthatwasaddedtotheimagewiththeselectiontool.
Adashedboxappearsaroundthetextorarrow.
UsethetoolsintheFontgrouptochangetheappearanceofthetextorarrow.
3.
ClickRotateCWorRotateCCWintheTextgrouptorotatethetextorarrow.
-29-DataAnalysis4.
ClickEditTextintheTextgrouptoviewtheTextPropertiesmenufortheselecteditem.
Insertdifferenttextoraddabordertothetextwiththismenu.
Iftheselecteditemisanarrow,clickanddragthesidesofthedashedboxtochangethesizeofthearrow.
-30-TablesImagedataarestoredinthefolderselectedastheWorkAreawhenImageStudioisopened.
ThedataareeasilyaccessedintheTablesbelowtheimagewindow.
IntheImagesTable,eachrowrepresentsoneimage.
Variousfieldsinthatrowcontainidentifyinginformationabouttheimage.
Thesefieldsaregroupedascolumnsthatcanbemoved,added,deleted,sorted,orfiltered.
ImagesTable1.
ClicktheImagestabatthetopleftoftheTabletoshowtheImagesTable.
2.
Hoverthemouseoveranyrowtodisplayathumbnailpictureofthatimage.
3.
Clickanycelltoselecttheentirerowanddisplaythatimageinthewindow.
4.
ClickthecornerbuttontoselectalloftheimagesorpressCtrl+Aonthekey-board.
5.
Right-clickanycelltoviewamenuwithoptionsthatincludeduplicateanimage,deleteanimage,orviewthepropertiesofanimage.
6.
Tomoveacolumn,dragthecolumnheadertothenewlocation.
Thefieldsineachrowcontaininformationabouttheimageandareorganizedascolumnsacrossalloftheimages.
Someofthecolumnsarepropertiesoftheimageandcannotbeedited.
ExamplesofthesecolumnsincludeImageID,-31-TablesAcquireTime,Channels,Resolution,andInstrumentName.
Othercolumnscanbeeditedwithinformationforthatimage.
7.
Toeditafield,double-clickonthecellsothatacursorappears.
Ifacursordoesnotappear,thatfieldcannotbeedited.
8.
Addtextwherethecursorappears.
PressEnterwhencomplete.
Note:Toeasilyfindimageslater,enteridentifyinginformationinoneormorefieldsafteracquiringanimage.
AddorRemoveaColumn1.
ClickColumnsonthetoprightoftheTabletoopentheImageColumnsmenu.
-32-Tables2.
ToaddtheExperimentcolumn,clickthecolumndescriptiontoenablethecheckbox,indicatingthatcolumnwillappearinthetable.
3.
ToremovetheResolutioncolumn,clickthecolumndescriptiontodisablethecheckboxandremovethatcolumnfromthetable.
4.
ClickSave.
Thetablenowappearsasshownbelow.
Note:Youcanalsoright-clicktheheaderofanycolumnandselectInsertColumnorRemoveColumnfromthepop-upmenutoquicklyaddorremoveacolumn.
AddCustomColumns1.
ClickColumnsonthetoprightoftheTabletoopentheImageColumnsmenu.
2.
IntheCustomColumnssection,replaceCustomImageColumn1withDepartment.
3.
ClickSave.
PasteDatainaColumnClickPasteatthetoprightoftheTabletoquicklyfillacolumnwithinformation.
1.
Double-clickthefirstcellintheCommentcolumnsothatacursorappearsinthecell.
2.
Type'Tutorial'atthecursorpositionusingthekeyboard.
3.
Dragthemouseover'Tutorial'tohighlightit.
Thecursorshouldstillappearinthecell.
4.
PressCtrl+Conthekeyboardtocopythedatatotheclipboard.
5.
DragthemouseoverthecellsintheCommentcolumn(orpresstheCtrlkeywhileclickingeachcellonce)toselectwhichcellstofillwith'Tutorial'.
6.
ClickPasteatthetoprightoftheTable,pressCtrl+Vonthekeyboard,orusetheright-clickmenutopastethedataintheselectedcells.
'Tutorial'addedtocellsinCommentcolumn.
PasteDatafromaSpreadsheettoaColumn1.
Inaspreadsheet,selectdataandpressCtrl+Conthekeyboardtocopythedatatotheclipboard.
-33-Tables2.
IntheTable,dragthemouseoverthecellsintheCommentcolumn(orpresstheCtrlkeywhileclickingeachcellonce)toselectthecellstofillwiththedata.
3.
ClickPasteinthetoprightoftheTable,pressCtrl+Vonthekeyboard,orusetheright-clickmenutopastethedataintheselectedcells.
CopyDatatoaSpreadsheetClickCopyatthetoprightoftheTabletoquicklycopyrowstoaspreadsheet.
1.
DragthemouseovertherowsorpresstheCtrlkeywhileclickingoneachrowoncetoselecttherowstocopy.
Tocopyallrows,pressCtrl+Aonthekeyboard.
2.
ClickCopyatthetoprightoftheTable,pressCtrl+Conthekeyboard,orusetheright-clickmenutocopythedatatotheclipboard.
3.
Inaspreadsheet,pressCtrl+Vonthekeyboardtopastethedataintheselectedcells.
Note:Thecolumnheadingswillbepastedabovethedata.
SortbyColumn1.
Tosortbyanycolumn,clickonceontheheader.
Thetablewillbesortedbythatcolumn.
Note:Nochangewillbemadeifthefieldsinacolumnareallthesame.
2.
Tochangethedirectionofsorting,clicktheheaderagain.
Or,right-clickontheheaderandselectSortAscendingorSortDescending.
FiltertheTableManually1.
Tomanuallychooseimages,dragtohighlighttherowstoselectthedesiredimages.
Or,selectthedesiredimagesbypressingCtrlonthekeyboardandclickingonceoneachrow.
2.
ClickFilteratthetoprightoftheTableandclickSelectionfromthedrop-downmenu.
Onlytheselectedimagesappearinthetable.
TheFilteredbut-tonatthebottomrightoftheTablewillbehighlighted.
3.
ClickFilteratthetoprightoftheTableandclickDisplayFilteredfromthedrop-downmenutotogglebetweenshowingonlytheselectedimagesandshowingallimagesinthetable.
4.
Toremovethefilter,clickFilteratthetoprightoftheTableandclickClearSelectionfromthedrop-downmenutoremoveonlytheSelectionfilter,orClearAlltoremoveallfilterscurrentlyapplied.
-34-TablesFilterbyColumnOneormoredefinedfilterscanbeappliedtoanycolumntoshowonlytheimagesofinterest.
1.
ClickFilteratthetoprightoftheTable.
2.
HoveroverColumntoviewthedrop-downmenuofthecurrentcolumnheadings.
3.
ClickAnalysistofilterusingtheAnalysiscolumn.
Note:Right-clickonanycolumnheaderintheTabletoviewadrop-downmenuforthatcolumn.
4.
DeselectICWandPlatebydisablingtheirrespectivecheckboxes.
5.
ClickOK.
OnlyimageswithoutICWorPlateintheAnalysiscolumnwillappearintheTable.
FormoreFilterOptions…1.
ClickFilteratthetoprightoftheTable.
2.
HoveroverColumntoviewthedrop-downmenuofthecurrentcolumnheadings.
3.
ClickAnalysistofilterusingtheAnalysiscolumn.
Note:Right-clickonanycolumnheaderintheTabletoviewadrop-downmenuforthatcolumn.
4.
ClickDefineFilters…inthetoppartofthepop-upmenu.
5.
ClickoneofthefilteringphrasestoshowtheColumnFilterAnalysismenu.
6.
Selectfilteringphrasesfromthedrop-downmenubyclickingonthedownarrowsnexttoeachbox,ortypeyourownphrase.
7.
ClickOK.
Note:IfyoucloseImageStudio,yourfilteringcriteriaarepreserved.
ViewtheShapesTable1.
ClicktheShapestabatthetopleftoftheTabletoviewthedataforeachshape.
2.
Thedefaultcolumnsaredefinedbelow.
a.
ImageName-Originalacquisitionnameb.
Channel-700,800,orotherchannelc.
Name-Shapesareassignedanumberinsequentialorder.
Double-clickonthenumberinthecolumntoedittheshapename.
d.
Signal-TheSignalisthesumoftheindividualpixelintensityvalues(Total)forashapeminustheproductoftheaverage/medianintensityvaluesofthepixelsinthebackground(Bkgnd.
)andthetotalnumberofpixelsenclosedbytheshape.
e.
Total-Sumoftheindividualpixelintensitiesfortheshapef.
Area-Totalnumberofpixelsenclosedbyashape-35-Tablesg.
Bkgnd.
-Designatedbackgroundsubtractionh.
Type-SignalorBackground3.
Move,add,delete,sort,andfilterthecolumnsinthesamewayasintheImagesTable.
ExportingDataClickSaveAsorLaunchSpreadsheetintheReportdrop-downmenutopre-pareoropenan'.
xls'filewiththeselecteddata.
ClickOptionstoselecttheformatofthefileandwhethertoexportselectedrowsorallrows.
SaveFile1.
ClickReportatthetoprightoftheTabletoopenthedrop-downmenu.
Choosethefileformat(textorxls)andwhethertoexportallrowsorselectedrows.
ClickSave.
2.
ClickSaveAstoopentheExportmenu.
3.
Browsetothedesireddestinationfolderorcreateanewone.
Youcanalsoeditthenameofthefile.
4.
ClickSave.
5.
Thefilewillbesavedintheselectedfolder.
LaunchSpreadsheet1.
ClickReportatthetoprightoftheTabletoopenthedrop-downmenu.
2.
ClickLaunchSpreadsheettoopentheLaunchSpreadsheetmenu.
3.
Browsetothedesireddestinationfolderorcreateanewone.
Youcanalsoeditthenameofthefile.
4.
ClickSave.
5.
Anapplicationthatusesthesetypesoffileswillopenwiththeselecteddataandcorrespondingcolumnheadings.
Print1.
ClickReportatthetoprightoftheTabletoopenthedrop-downmenu.
2.
ClickPrintandthedocumentwillbesenttothedefaultprinter.
3.
SelectthedefaultprinterbyclickingtheImageStudioApplicationbutton,hoveringoverPrint,andclickingSelectPrinter.
-36-TablesOptions1.
ClickReportatthetoprightoftheTabletoopenthedrop-downmenu.
2.
ClickOptionstoopentheReportOptionsmenu.
3.
ChoosethefileformatandwhethertoexportallrowsintheTableorjustselectedrows.
4.
ClickSave.
-37-ReportingPrintanImage1.
Clicktheprintericoninthequickaccesstoolbar,pressCtrl+Ponthekey-board,orclicktheImageStudioApplicationButtonandhoveroverPrint.
2.
ClickSingleImagePerPagetoprintthecurrentlydisplayedimage.
CreateaLabBookPDF1.
ClicktheLabBooktabatthetopoftheapplicationwindowtoopentheLabBookribbon.
2.
ClickthefirstbuttonontheLabBookribbontoopenadrop-downlistofpos-siblelabbooktemplates.
3.
ClickSingleImagePerPagetoselectthistemplate.
4.
ClickEditintheLabBookribbontoopentheLabBookLayoutEditormenu.
Youcanaddorremovepartsofthelabbook,creatingaCustomLabBook.
TosaveaCustomLabBook,clickthefirstbuttonandselectSaveCurrentLabBookatthebottomofthedrop-downlist.
-39-Reporting5.
ClickHeaderOptionstoopentheLabBookHeaderOptionsmenu.
Youcanselectanimagetoappearintheheader,anduptothreelinesofinform-ation.
6.
ClickPageSetuptoselectthesizeofthepaperandsetthemargins.
ClickPrintPreviewtoviewthecurrentlabbook.
ClickSavetocreateaPDFofthelabbook.
-40-ReportingPrintaLabBook1.
Clicktheprintericoninthequickaccesstoolbar,pressCtrl+Ponthekey-board,orclicktheImageStudioApplicationButtonandhoveroverPrint.
2.
ClickLabBooktoprintthecurrentlabbook.
CreateaChart1.
ClicktheCharttabontherightoftheapplicationwindow.
2.
ClickthebuttonatthetopleftoftheChartviewandchooseatemplatefromthedrop-downmenu.
Note:Whenyoueditthechart,thebuttonwillchangetoCustom.
YoucansavetheeditedchartbyclickingSaveCurrentChartTemplate.
3.
YoucaneditthechartusingthebuttonsonthetoprightoftheChartview.
a.
Type-ChooseBarChartorScatterPlot.
b.
Data-Specifythedatatouseinthechart.
c.
Options-Selectfromseveralscalingoptionsforthey-andx-axes.
d.
Labels-Designateatitleforthechartandthey-andx-axes.
e.
Color-Chooseacolorstyle.
f.
Export-SelectSaveAs,Print,orCopy.
-41-
- analyseslinpuslite相关文档
- Meterlinpuslite
- 支持linpuslite
- Richlinpuslite
- 继电器linpuslite
- Menuslinpuslite
- 调光器linpuslite
百驰云(19/月),高性能服务器,香港三网CN2 2核2G 10M 国内、香港、美国、日本、VPS、物理机、站群全站7.5折,无理由退换,IP免费换!
百驰云成立于2017年,是一家新国人IDC商家,且正规持证IDC/ISP/CDN,商家主要提供数据中心基础服务、互联网业务解决方案,及专属服务器租用、云服务器、云虚拟主机、专属服务器托管、带宽租用等产品和服务。百驰云提供源自大陆、香港、韩国和美国等地骨干级机房优质资源,包括BGP国际多线网络,CN2点对点直连带宽以及国际顶尖品牌硬件。专注为个人开发者用户,中小型,大型企业用户提供一站式核心网络云端...

spinservers($89/月),圣何塞10Gbps带宽服务器,达拉斯10Gbps服务器
spinservers是Majestic Hosting Solutions LLC旗下站点,主要提供国外服务器租用和Hybrid Dedicated等产品的商家,数据中心包括美国达拉斯和圣何塞机房,机器一般10Gbps端口带宽,高配置硬件,支持使用PayPal、信用卡、支付宝或者微信等付款方式。目前,商家针对部分服务器提供优惠码,优惠后达拉斯机房服务器最低每月89美元起,圣何塞机房服务器最低每月...

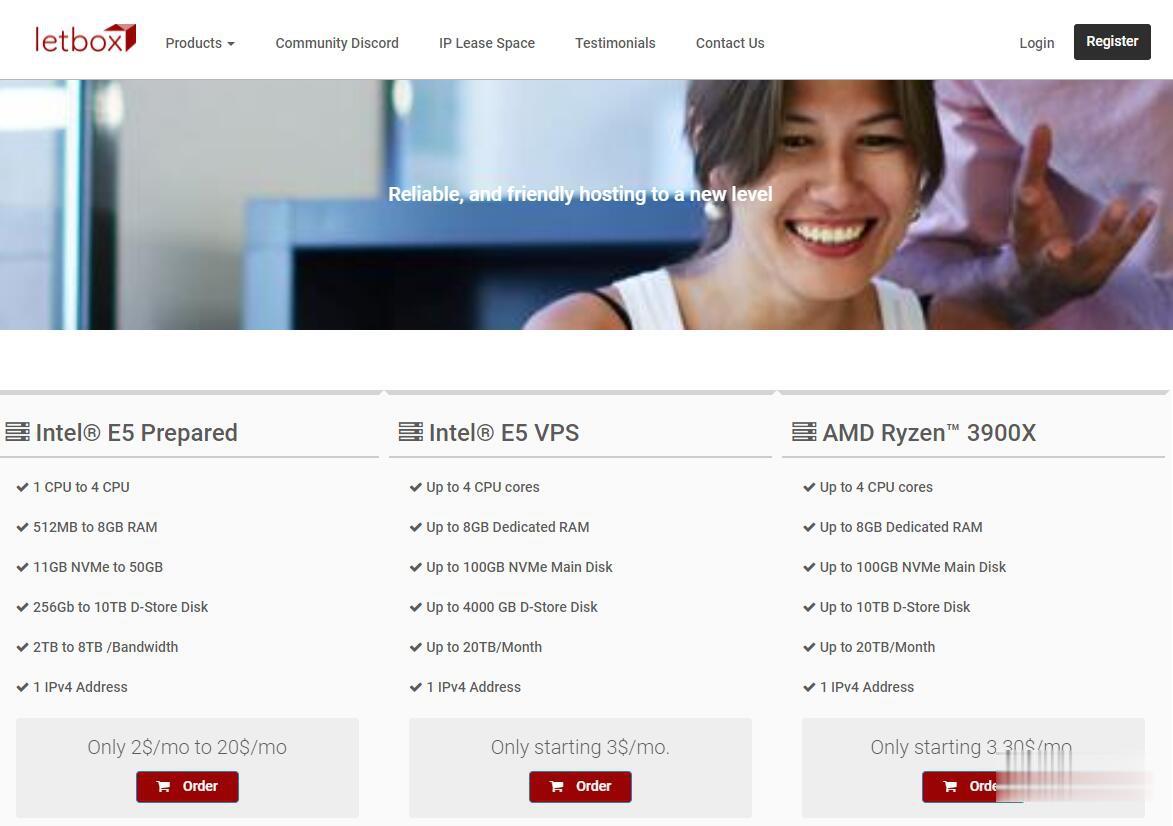
LetBox:美国洛杉矶/新泽西AMD大硬盘VPS,10TB流量,充值返余额,最低3.3美元两个月
LetBox此次促销依然是AMD Ryzen处理器+NVME硬盘+HDD大硬盘,以前是5TB月流量,现在免费升级到10TB月流量。另外还有返余额的活动,如果月付,月付多少返多少;如果季付或者半年付,返25%;如果年付,返10%。依然全部KVM虚拟化,可自定义ISO系统。需要大硬盘vps、大流量vps、便宜AMD VPS的朋友不要错过了。不过LetBox对帐号审核严格,最好注册邮箱和paypal帐号...

linpuslite为你推荐
-
ip购买买一个电信的固定IP多少钱啊?敬汉卿姓名被抢注如果有一定影响力的笔名,被某个产品抢注,能否起诉告其侵权?2020双十一成绩单2020考研成绩出分后需要做什么?巨星prince去世作者为什么把伏尔泰的逝世说成是巨星陨落同ip网站查询我的两个网站在同一个IP下,没被百度收录,用同IP站点查询工具查询时也找不到我的网站,是何原因?www.20ren.com有什么好看的电影吗?来几个…www.kanav001.com翻译为日文: 主人,请你收养我一天吧. 带上罗马音标会更好www抓站工具仿站必备软件有哪些工具?最好好用的仿站工具是那个几个?www.bbb551.com100bbb网站怎样上不去了www.se222se.com原来的www站到底222eee怎么了莫非不是不能222eee在收视com了,/?求解